


 Add to Reddit

Surface Temperature
We monitored the surface temperature of both hard drives during their benchmarks. The following chart shows their operating temperature range, from idle to maximum load. Please note that instead of giving you the absolute numbers, we are showing the temperature delta, which is the difference between the actual temperature and the ambient room temperature.
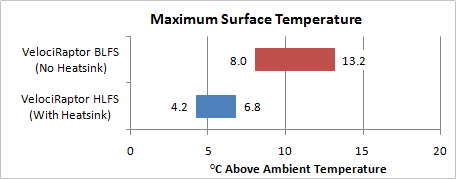
Surprisingly, the VelociRaptor HLFS' IcePack mounting frame had a significant effect on its operating temperature. Even though there was only four contact points and the mounting frame itself was barely (1.2 °C) warmer than the ambient temperature, the mounting frame (which also serves as a heatsink) dropped the VelociRaptor HLFS' load temperature by 6.4 °C. In fact, at full load, the VelociRaptor HLFS is actually 1.2 °C cooler than the VelociRaptor BLFS at idle!
Based on the results, the VelociRaptor HLFS with its IcePack mounting frame certainly has an advantage over the VelociRaptor BLFS bare drive. With that said, a temperature delta of 13.2 °C isn't particularly hot. Even with an ambient temperature of 35 °C, the actual surface temperature would only be 48.2 °C. To put things into perspective, the VelociRaptor HLFS would have a maximum surface temperature of 41.8 °C at the same ambient temperature.
WinBench 99 Version 2.0
Platter Data Transfer Profile
)
As expected, both the VelociRaptor BLFS and the VelociRaptor HFLS have the same platter transfer rate profile. However, the VelociRaptor BLFS appears to be consistently higher transfer rates across the platter.
Page |
Topic |
|
1 |
||
2 |
||
3 |
||
4 |
||
5 |
||
6 |
||
7 |
Support Tech ARP!
If you like our work, you can help support out work by visiting our sponsors, participate in the Tech ARP Forums, or even donate to our fund. Any help you can render is greatly appreciated!