


 Add to Reddit

IOPS Scaling
In these tests, we tested the drive's ability to tackle multiple input/output operations. Again, we compared the 3 TB Western Digital Red (WD30EFRX) to the 3 TB Western Digital Caviar Green (WD30EZRX), because it was the closest match and would have been used instead of the WD Red in a NAS system. For more performance comparisons, please take a look at The Hard Disk Drive Performance Comparison Guide.
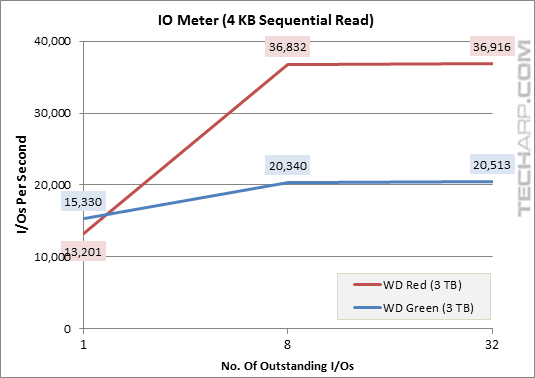
4 KB Sequential Read
Outstanding I/Os |
WD Red (3 TB) |
WD Green (3 TB) |
Difference |
1 |
13,201 IOPS |
15,330 IOPS |
- 13.9% |
8 |
36,832 IOPS |
20,340 IOPS |
+ 81.1% |
32 |
36,916 IOPS |
20,513 IOPS |
+ 80.0% |
Surprisingly, when more transactions were piled on, the WD Red's small sequential read performance almost tripled, jumping from 14% slower than the WD Green to almost twice as fast!
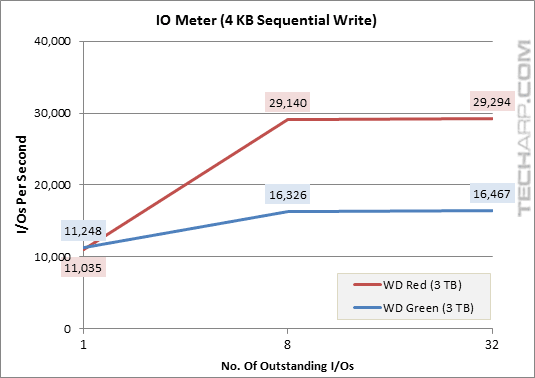
4 KB Sequential Write
Outstanding I/Os |
WD Red (3 TB) |
WD Green (3 TB) |
Difference |
1 |
11,035 IOPS |
11,248 IOPS |
- 1.9% |
8 |
29,140 IOPS |
16,326 IOPS |
+ 78.5% |
32 |
29,294 IOPS |
16,467 IOPS |
+ 77.9% |
The same thing happened for small sequential read performance. When the number of simultaneous transactions increased, the WD Red's performance jumped and it was much faster than the the WD Green.
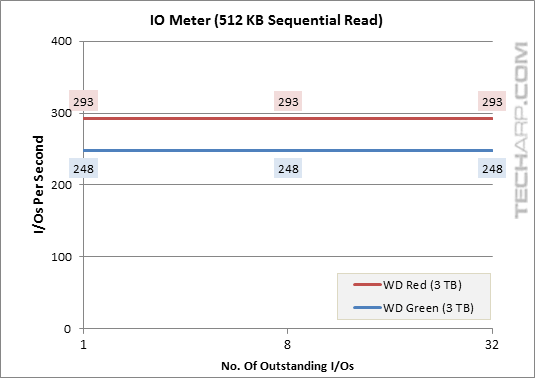
512 KB Sequential Read
Outstanding I/Os |
WD Red (3 TB) |
WD Green (3 TB) |
Difference |
1 |
293 IOPS |
248 IOPS |
+ 18.0% |
8 |
293 IOPS |
248 IOPS |
+ 17.9% |
32 |
293 IOPS |
248 IOPS |
+ 18.1% |
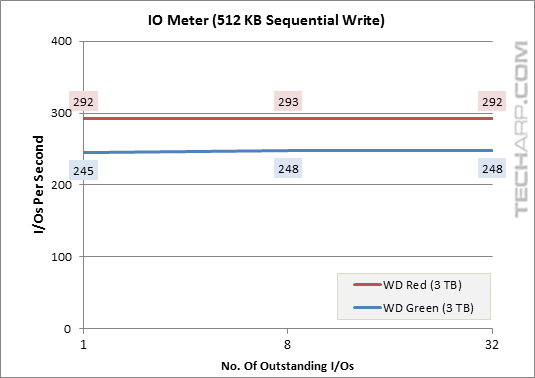
512 KB Sequential Write
Outstanding I/Os |
WD Red (3 TB) |
WD Green (3 TB) |
Difference |
1 |
292 IOPS |
245 IOPS |
+ 19.2% |
8 |
293 IOPS |
248 IOPS |
+ 18.2% |
32 |
292 IOPS |
248 IOPS |
+ 17.7% |
Support Tech ARP!
If you like our work, you can help support out work by visiting our sponsors, participate in the Tech ARP Forums, or even donate to our fund. Any help you can render is greatly appreciated!
Page |
Topic |
|
1 |
||
2 |
||
3 |
• The 3 TB Western Digital Red |
|
4 |
• Peeking Under The PCB |
|
5 |
||
6 |
• Testing The 3 TB Western Digital Red |
|
7 |
||
8 |
||
9 |
||
10 |
||
11 |
||
12 |
||
13 |