


 Add to Reddit

IOPS Scaling
In these tests, we tested the drive's ability to tackle multiple input/output operations. Again, we compared the OCZ Agility 2 (E) to the Intel X25-M G2 (34 nm). If you wish to see how the OCZ Agility 2 (E) compares to other solid state drives, please take a look at our Solid State Drive Performance Comparison Guide.
Do note that these results are based on the average of separate tests using compressible and non-compressible data. This is to address the fact the newer SSD controllers like the SandForce SF-1222 compress data for better performance and lower wear on the memory cells.
4 KB Random Read
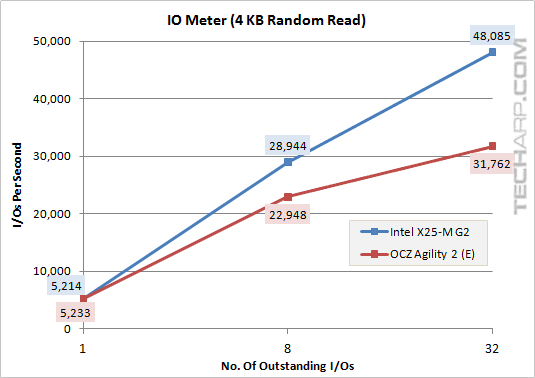
Outstanding I/Os |
OCZ Agility 2 (E) |
Intel X25-M G2 |
Difference |
1 |
5,233 IOPS |
5,214 IOPS |
+ 0.4% |
8 |
22,948 IOPS |
28,944 IOPS |
- 20.7% |
32 |
31,762 IOPS |
48,085 IOPS |
- 33.9% |
4 KB Random Write
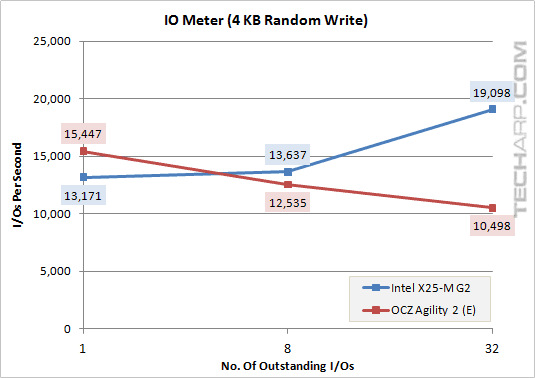
Outstanding I/Os |
OCZ Agility 2 (E) |
Intel X25-M G2 |
Difference |
1 |
15,447 IOPS |
13,171 IOPS |
+ 17.3% |
8 |
12,535 IOPS |
13,637 IOPS |
- 8.3% |
32 |
10,498 IOPS |
19,098 IOPS |
- 45.0% |
512 KB Random Read
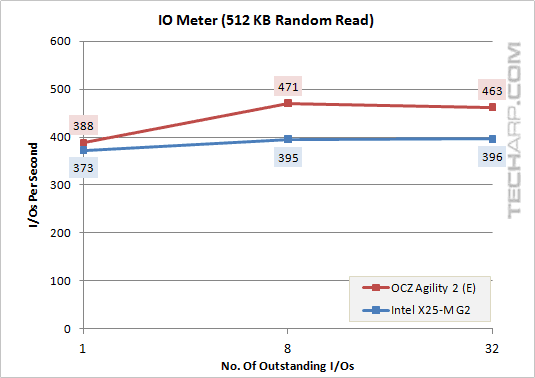
Outstanding I/Os |
OCZ Agility 2 (E) |
Intel X25-M G2 |
Difference |
1 |
388 IOPS |
373 IOPS |
+ 4.2% |
8 |
471 IOPS |
395 IOPS |
+ 19.1% |
32 |
463 IOPS |
396 IOPS |
+ 16.8% |
512 KB Random Write
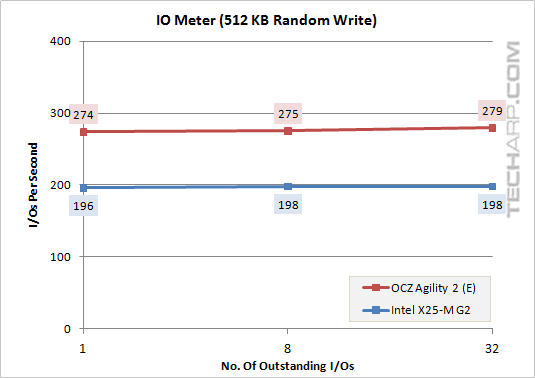
Outstanding I/Os |
OCZ Agility 2 (E) |
Intel X25-M G2 |
Difference |
1 |
274 IOPS |
196 IOPS |
+ 40.0% |
8 |
275 IOPS |
198 IOPS |
+ 39.0% |
32 |
279 IOPS |
198 IOPS |
+ 41.2% |
Support Tech ARP!
If you like our work, you can help support out work by visiting our sponsors, participate in the Tech ARP Forums, or even donate to our fund. Any help you can render is greatly appreciated!
Page |
Topic |
|
1 |
||
2 |
||
3 |
• The Agility 2 (E) 60 GB SSD |
|
4 |
||
5 |
||
6 |
||
7 |
||
8 |
||
9 |
||
10 |
||
11 |
||
12 |
<<< IO Meter Sequential Access Results : Previous Page | Next Page : IOPS Scaling Results (Sequential Access) >>>