


 Add to Reddit

IOPS Scaling
In these tests, we tested the drive's ability to tackle multiple input/output operations. Again, we compared the OCZ Agility 2 (E) to the Intel X25-M G2 (34 nm). If you wish to see how the OCZ Agility 2 (E) compares to other solid state drives, please take a look at our Solid State Drive Performance Comparison Guide.
Do note that these results are based on the average of separate tests using compressible and non-compressible data. This is to address the fact the newer SSD controllers like the SandForce SF-1222 compress data for better performance and lower wear on the memory cells.
4 KB Sequential Read
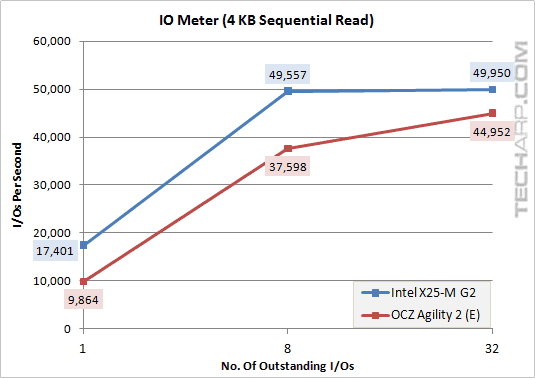
Outstanding I/Os |
OCZ Agility 2 (E) |
Intel X25-M G2 |
Difference |
1 |
9,864 IOPS |
17,401 IOPS |
- 43.3% |
8 |
37,598 IOPS |
49,557 IOPS |
- 24.1% |
32 |
44,952 IOPS |
49,950 IOPS |
- 10.0% |
4 KB Sequential Write
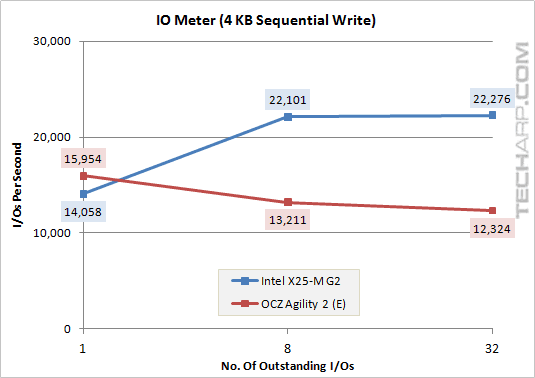
Outstanding I/Os |
OCZ Agility 2 (E) |
Intel X25-M G2 |
Difference |
1 |
15,954 IOPS |
14,058 IOPS |
+ 13.5% |
8 |
13,211 IOPS |
22,101 IOPS |
- 40.2% |
32 |
12,324 IOPS |
22,276 IOPS |
- 44.7% |
512 KB Sequential Read
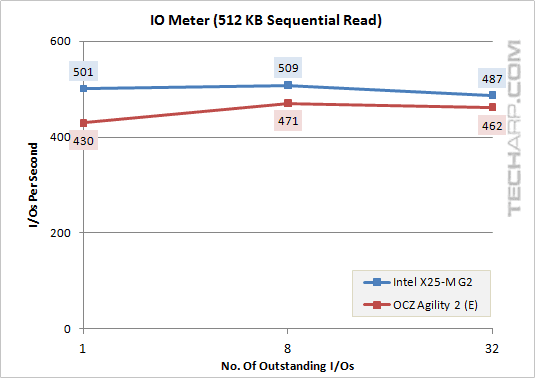
Outstanding I/Os |
OCZ Agility 2 (E) |
Intel X25-M G2 |
Difference |
1 |
430 IOPS |
501 IOPS |
- 14.2% |
8 |
471 IOPS |
509 IOPS |
- 7.4% |
32 |
462 IOPS |
487 IOPS |
- 5.1% |
512 KB Sequential Write
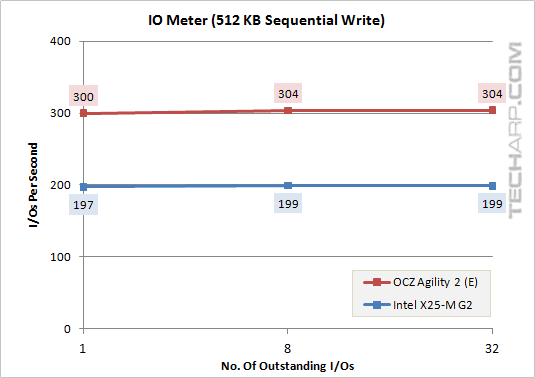
Outstanding I/Os |
OCZ Agility 2 (E) |
Intel X25-M G2 |
Difference |
1 |
300 IOPS |
197 IOPS |
+ 52.1% |
8 |
304 IOPS |
199 IOPS |
+ 52.5% |
32 |
304 IOPS |
199 IOPS |
+ 53.0% |
Support Tech ARP!
If you like our work, you can help support out work by visiting our sponsors, participate in the Tech ARP Forums, or even donate to our fund. Any help you can render is greatly appreciated!
Page |
Topic |
|
1 |
||
2 |
||
3 |
• The Agility 2 (E) 60 GB SSD |
|
4 |
||
5 |
||
6 |
||
7 |
||
8 |
||
9 |
||
10 |
||
11 |
||
12 |