


 Add to Reddit

IO Meter
We compared the 4 TB Western Digital Red Pro (WD4001FFSX) to the 4 TB Western Digital Red (WD40EFRX). For more performance comparisons, please take a look at The Hard Disk Drive Performance Comparison Guide.
Throughput (Random Access)
Test |
WD Red Pro (4 TB) |
WD Red (4 TB) |
Difference |
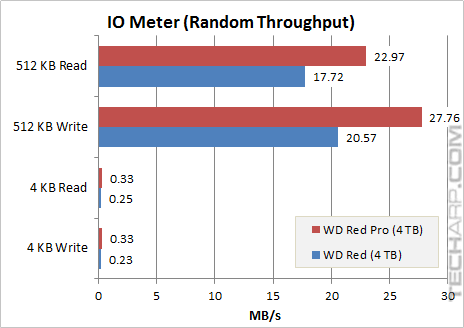
512 KB Read |
22.97 MB/s |
17.72 MB/s |
+ 29.6% |
512 KB Write |
27.76 MB/s |
20.57 MB/s |
+ 35.0% |
4 KB Read |
0.33 MB/s |
0.25 MB/s |
+ 32.0% |
4 KB Write |
0.33 MB/s |
0.23 MB/s |
+ 43.5% |
The small random reads and writes are the most important tests for applications that make a lot of random accesses, so those would be key performance indicators for drives that are used as boot or system drives, but not very important for NAS systems.
The 4 TB Red Pro (WD4001FFSX) was significantly faster than the 4 TB Red (WD40EFRX), thanks to its higher spindle speed. This wouldn't make much of a difference in a NAS system though.
Random Access Time
Test |
WD Red Pro (4 TB) |
WD Red (4 TB) |
Difference |
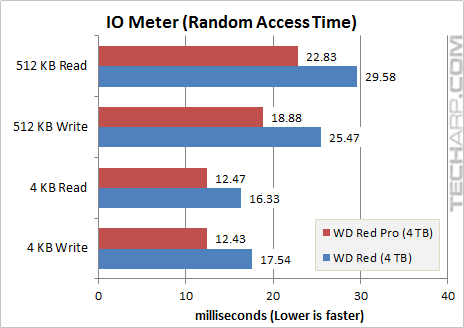
512 KB Read |
22.83 ms |
29.58 ms |
- 22.8% |
512 KB Write |
18.88 ms |
25.47 ms |
- 25.9% |
4 KB Read |
12.47 ms |
16.33 ms |
- 23.7% |
4 KB Write |
12.43 ms |
17.54 ms |
- 29.1% |
The 4 TB Red Pro's better random read results were confirmed by its random read access times. As you can see, the 4 TB Red Pro's random access times were much shorter than those of the 4 TB Red.
CPU Utilization (Random Access)
Test |
WD Red Pro (4 TB) |
WD Red (4 TB) |
Difference |
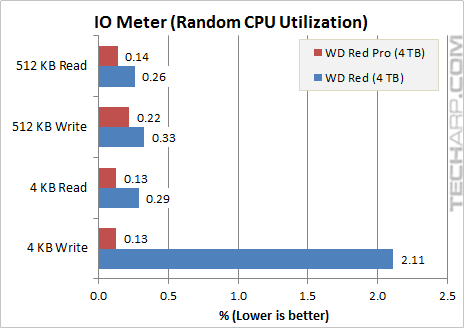
512 KB Read |
0.14% |
0.26% |
- 46.2% |
512 KB Write |
0.22% |
0.33% |
- 33.3% |
4 KB Read |
0.13% |
0.29% |
- 55.2% |
4 KB Write |
0.13% |
2.11% |
- 93.8% |
Throughput (Sequential Access)
Test |
WD Red Pro (4 TB) |
WD Red (4 TB) |
Difference |
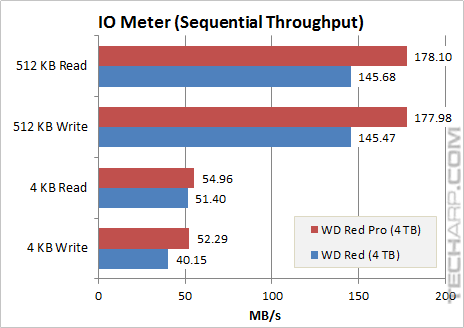
512 KB Read |
178.10 MB/s |
145.68 MB/s |
+ 22.3% |
512 KB Write |
177.98 MB/s |
145.47 MB/s |
+ 22.3% |
4 KB Read |
54.96 MB/s |
51.40 MB/s |
+ 6.9% |
4 KB Write |
52.29 MB/s |
40.15 MB/s |
+ 30.2% |
This is the most important test for the WD Red Pro because it shows its ability to read and write files sequentially. The large sequential transfer performance is particularly important since many NAS system deal with large files (larger than 512 KB in this context).
The 4 TB Red Pro was much faster than the 4 TB Red, again due to its higher spindle speed. The Red drive was quite strong in small reads though, closing the gap to just under 7%. However, the small read and write performance aren't as important as the large read and write performance in a NAS system.
Sequential Access Time
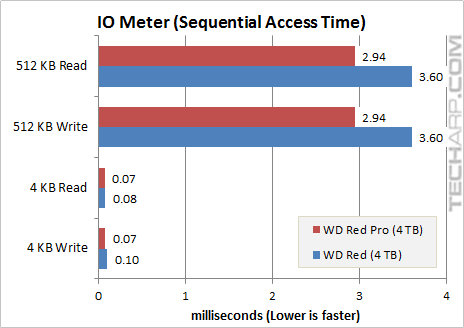
Test |
WD Red Pro (4 TB) |
WD Red (4 TB) |
Difference |
512 KB Read |
2.94 ms |
3.60 ms |
- 18.2% |
512 KB Write |
2.94 ms |
3.60 ms |
- 18.2% |
4 KB Read |
0.07 ms |
0.08 ms |
- 10.9% |
4 KB Write |
0.07 ms |
0.10 ms |
- 25.1% |
CPU Utilization (Sequential Access)
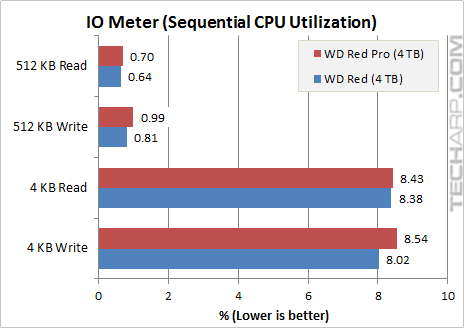
Test |
WD Red Pro (4 TB) |
WD Red (4 TB) |
Difference |
512 KB Read |
0.70% |
0.64% |
+ 9.4% |
512 KB Write |
0.99% |
0.81% |
+ 22.2% |
4 KB Read |
8.43% |
8.38% |
+ 0.6% |
4 KB Write |
8.54% |
8.02% |
+ 6.5% |
Support Tech ARP!
If you like our work, you can help support out work by visiting our sponsors, participate in the Tech ARP Forums, or even donate to our fund. Any help you can render is greatly appreciated!
Page |
4 TB Western Digital Red Pro Review |
|
1 |
||
2 |
||
3 |
||
4 |
• WD Red Pro Hardware Enhancements |
|
5 |
• Testing The Western Digital Red Pro |
|
6 |
• Transfer Rate Range, Platter Profile |
|
7 |
||
8 |
||
9 |
||
10 |
Support us by buying from Amazon.com! |
|
| Grab a FREE 30-day trial of Amazon Prime for free shipping, instant access to 40,000 movies and TV episodes and the Kindle Owners' Lending Library! | |
<<< Transfer Rate Range, Platter Profile, WinBench 99 Results : Previous Page | Next Page : IOPS Scaling (Random Access) >>>