


 Add to Reddit

IOPS Scaling
In these tests, we tested the drive's ability to tackle multiple input/output operations. Again, we compared the 3 TB Western Digital Red (WD30EFRX) to the 3 TB Western Digital Caviar Green (WD30EZRX), because it was the closest match and would have been used instead of the WD Red in a NAS system. For more performance comparisons, please take a look at The Hard Disk Drive Performance Comparison Guide.
4 KB Random Read
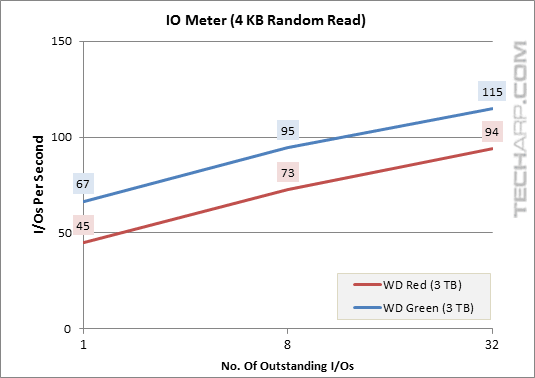
Outstanding I/Os |
WD Red (3 TB) |
WD Green (3 TB) |
Difference |
1 |
45 IOPS |
67 IOPS |
- 32.6% |
8 |
73 IOPS |
95 IOPS |
- 23.3% |
32 |
94 IOPS |
115 IOPS |
- 18.3% |
Although the WD Red's dual-core processor was hampered by the significantly slower random access time, it appeared to help close the gap as the number of sequential transactions increased.
4 KB Random Write
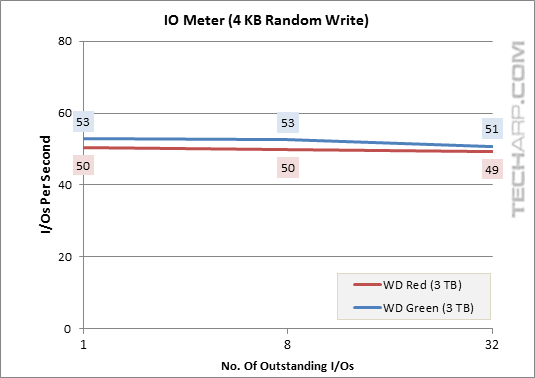
Outstanding I/Os |
WD Red (3 TB) |
WD Green (3 TB) |
Difference |
1 |
50 IOPS |
53 IOPS |
- 4.5% |
8 |
50 IOPS |
53 IOPS |
- 5.3% |
32 |
49 IOPS |
51 IOPS |
- 2.9% |
512 KB Random Read
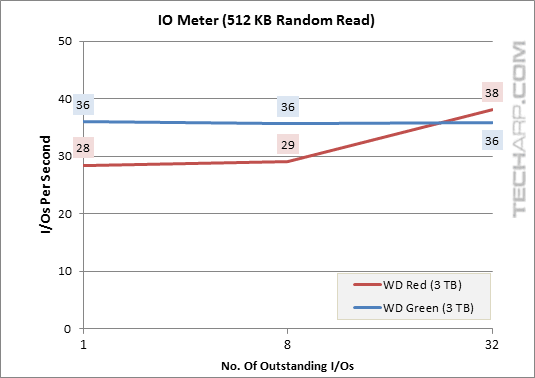
Outstanding I/Os |
WD Red (3 TB) |
WD Green (3 TB) |
Difference |
1 |
28 IOPS |
36 IOPS |
- 20.9% |
8 |
29 IOPS |
36 IOPS |
- 18.4% |
32 |
38 IOPS |
36 IOPS |
+ 6.2% |
512 KB Random Write
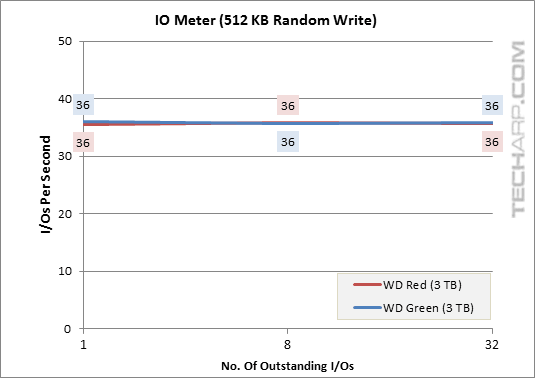
Outstanding I/Os |
WD Red (3 TB) |
WD Green (3 TB) |
Difference |
1 |
36 IOPS |
36 IOPS |
- 1.2% |
8 |
36 IOPS |
36 IOPS |
+ 0.7% |
32 |
36 IOPS |
36 IOPS |
- 0.8% |
Support Tech ARP!
If you like our work, you can help support out work by visiting our sponsors, participate in the Tech ARP Forums, or even donate to our fund. Any help you can render is greatly appreciated!
Page |
Topic |
|
1 |
||
2 |
||
3 |
• The 3 TB Western Digital Red |
|
4 |
• Peeking Under The PCB |
|
5 |
||
6 |
• Testing The 3 TB Western Digital Red |
|
7 |
||
8 |
||
9 |
||
10 |
||
11 |
||
12 |
||
13 |
<<< IO Meter Sequential Access Performance : Previous Page | Next Page : IOPS Scaling (Sequential Access) >>>