


 Add to Reddit

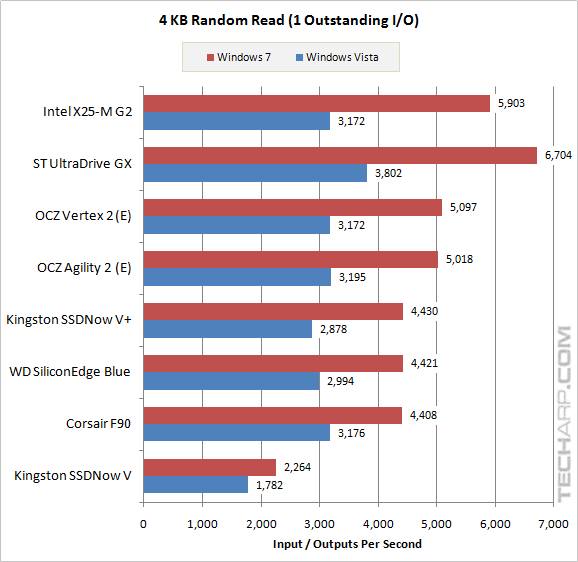
IOPS Scaling - 4 KB Random Read
1 Outstanding I/O
Solid State Drive |
Windows 7 |
Windows Vista |
Difference |
Intel X25-M G2 (34 nm) |
5,903 IOPS |
3,172 IOPS |
+ 86.1% |
Super Talent UltraDrive GX |
6,704 IOPS |
3,802 IOPS |
+ 76.3% |
OCZ Vertex 2 (E) |
5,097 IOPS |
3,172 IOPS |
+ 60.7% |
OCZ Agility 2 (E) |
5,018 IOPS |
3,195 IOPS |
+ 57.1% |
Kingston SSDNow V+ (Gen. 2) |
4,430 IOPS |
2,878 IOPS |
+ 53.9% |
Western Digital SiliconEdge Blue |
4,421 IOPS |
2,994 IOPS |
+ 47.6% |
Corsair F90 |
4,408 IOPS |
3,176 IOPS |
+ 38.8% |
Kingston SSDNow V (Gen. 2) |
2,264 IOPS |
1,782 IOPS |
+ 27.1% |
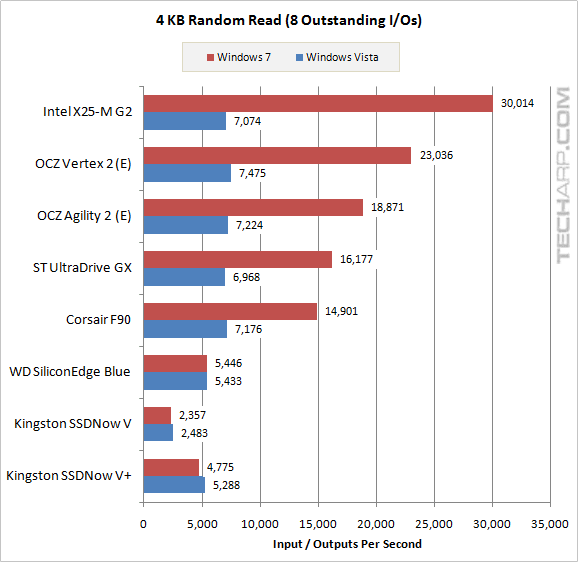
8 Outstanding I/Os
Solid State Drive |
Windows 7 |
Windows Vista |
Difference |
Intel X25-M G2 (34 nm) |
30,014 IOPS |
7,074 IOPS |
+ 324.3% |
OCZ Vertex 2 (E) |
23,036 IOPS |
7,475 IOPS |
+ 208.2% |
OCZ Agility 2 (E) |
18,871 IOPS |
7,224 IOPS |
+ 161.2% |
Super Talent UltraDrive GX |
16,177 IOPS |
6,968 IOPS |
+ 132.2% |
Corsair F90 |
14,901 IOPS |
7,176 IOPS |
+ 107.6% |
Western Digital SiliconEdge Blue |
5,446 IOPS |
5,433 IOPS |
+ 0.2% |
Kingston SSDNow V (Gen. 2) |
2,357 IOPS |
2,483 IOPS |
- 5.0% |
Kingston SSDNow V+ (Gen. 2) |
4,775 IOPS |
5,288 IOPS |
- 9.7% |
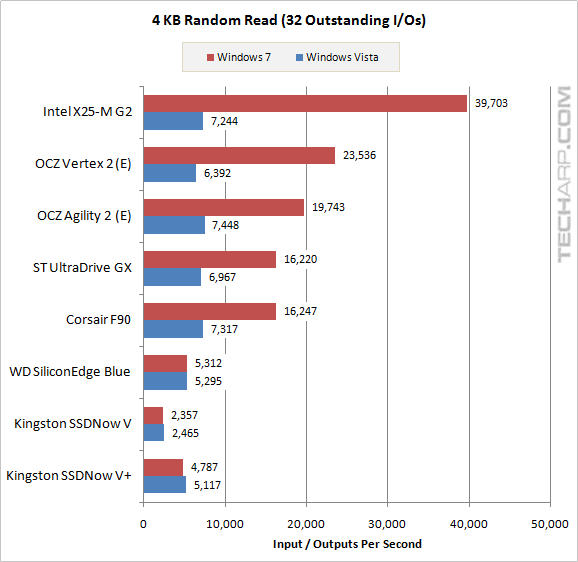
32 Outstanding I/Os
Solid State Drive |
Windows 7 |
Windows Vista |
Difference |
Intel X25-M G2 (34 nm) |
39,703 IOPS |
7,244 IOPS |
+ 448.1% |
OCZ Vertex 2 (E) |
23,536 IOPS |
6,392 IOPS |
+ 268.2% |
OCZ Agility 2 (E) |
19,743 IOPS |
7,448 IOPS |
+ 165.1% |
Super Talent UltraDrive GX |
16,220 IOPS |
6,967 IOPS |
+ 132.8% |
Corsair F90 |
16,247 IOPS |
7,317 IOPS |
+ 122.1% |
Western Digital SiliconEdge Blue |
5,312 IOPS |
5,295 IOPS |
+ 0.3% |
Kingston SSDNow V (Gen. 2) |
2,357 IOPS |
2,465 IOPS |
- 4.4% |
Kingston SSDNow V+ (Gen. 2) |
4,787 IOPS |
5,117 IOPS |
- 6.4% |
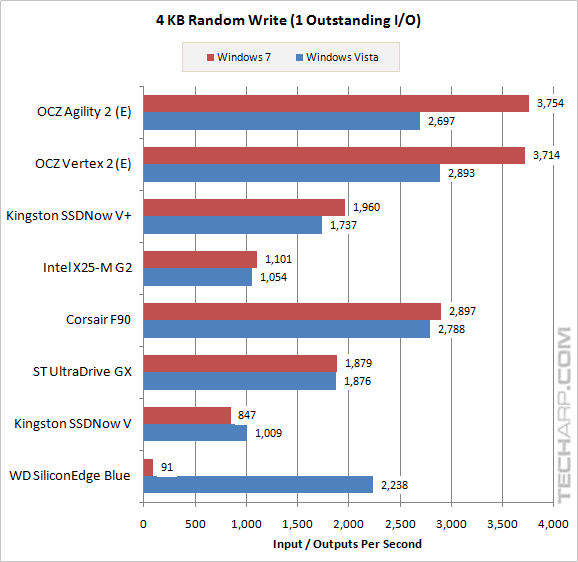
IOPS Scaling - 4 KB Random Write
1 Outstanding I/O
Solid State Drive |
Windows 7 |
Windows Vista |
Difference |
OCZ Agility 2 (E) |
3,754 IOPS |
2,697 IOPS |
+ 39.2% |
OCZ Vertex 2 (E) |
3,714 IOPS |
2,893 IOPS |
+ 28.4% |
Kingston SSDNow V+ (Gen. 2) |
1,960 IOPS |
1,737 IOPS |
+ 12.9% |
Intel X25-M G2 (34 nm) |
1,101 IOPS |
1,054 IOPS |
+ 4.5% |
Corsair F90 |
2,897 IOPS |
2,788 IOPS |
+ 3.9% |
Super Talent UltraDrive GX |
1,879 IOPS |
1,876 IOPS |
+ 0.2% |
Kingston SSDNow V (Gen. 2) |
847 IOPS |
1,009 IOPS |
- 16.0% |
Western Digital SiliconEdge Blue |
91 IOPS |
2,238 IOPS |
- 96.0% |
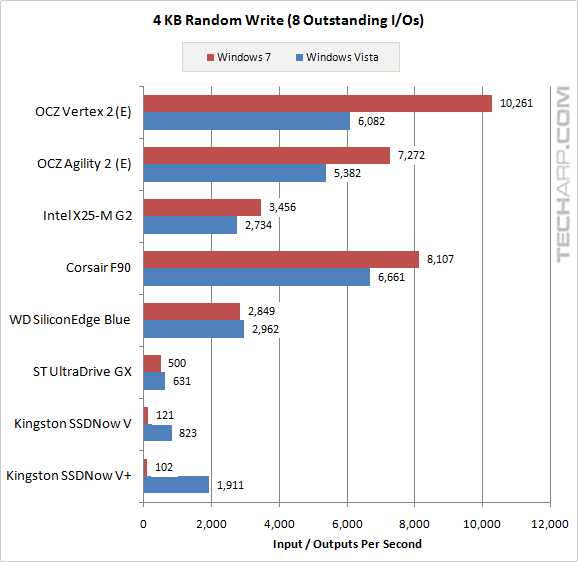
8 Outstanding I/Os
Solid State Drive |
Windows 7 |
Windows Vista |
Difference |
OCZ Vertex 2 (E) |
10,261 IOPS |
6,082 IOPS |
+ 68.7% |
OCZ Agility 2 (E) |
7,272 IOPS |
5,382 IOPS |
+ 35.1% |
Intel X25-M G2 (34 nm) |
3,456 IOPS |
2,734 IOPS |
+ 26.4% |
Corsair F90 |
8,107 IOPS |
6,661 IOPS |
+ 21.7% |
Western Digital SiliconEdge Blue |
2,849 IOPS |
2,962 IOPS |
- 3.8% |
Super Talent UltraDrive GX |
500 IOPS |
631 IOPS |
- 20.7% |
Kingston SSDNow V (Gen. 2) |
121 IOPS |
823 IOPS |
- 85.3% |
Kingston SSDNow V+ (Gen. 2) |
102 IOPS |
1,911 IOPS |
- 94.7% |
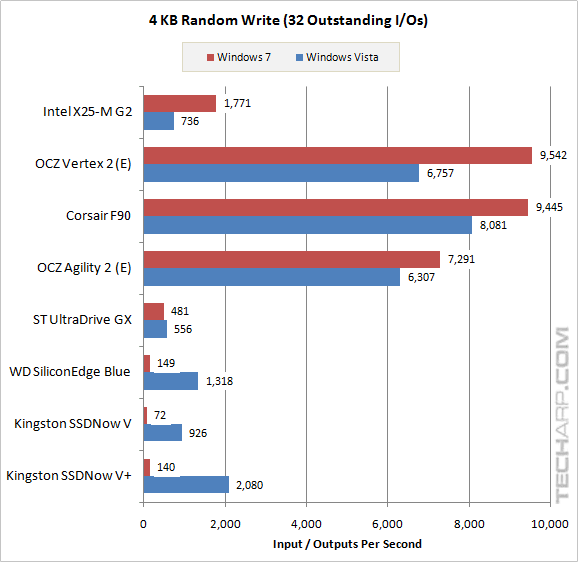
32 Outstanding I/Os
Solid State Drive |
Windows 7 |
Windows Vista |
Difference |
Intel X25-M G2 (34 nm) |
1,771 IOPS |
736 IOPS |
+ 140.6% |
OCZ Vertex 2 (E) |
9,542 IOPS |
6,757 IOPS |
+ 41.2% |
Corsair F90 |
9,445 IOPS |
8,081 IOPS |
+ 16.9% |
OCZ Agility 2 (E) |
7,291 IOPS |
6,307 IOPS |
+ 15.6% |
Super Talent UltraDrive GX |
481 IOPS |
556 IOPS |
- 13.5% |
Western Digital SiliconEdge Blue |
149 IOPS |
1,318 IOPS |
- 88.7% |
Kingston SSDNow V (Gen. 2) |
72 IOPS |
926 IOPS |
- 92.3% |
Kingston SSDNow V+ (Gen. 2) |
140 IOPS |
2,080 IOPS |
- 93.3% |
Support Tech ARP!
If you like our work, you can help support out work by visiting our sponsors, participate in the Tech ARP Forums, or even donate to our fund. Any help you can render is greatly appreciated!
Introduction |
||
| Transfer Rate & Access Time |
||
| IOPS Scaling | ||
Conclusion |
<<< 512 KB Sequential Read + Write Performance : Previous Page | Next Page : 512 KB Random Read + Write IOPS Scaling >>>