


 Add to Reddit

IOPS Scaling
In these tests, we tested the drive's ability to tackle multiple input/output operations. Again, we compared the Western Digital Caviar Green AFT 3 TB to the Western Digital Caviar Green AFT 2 TB. For more performance comparisons, please take a look at The Hard Disk Drive Performance Comparison Guide.
4 KB Random Read
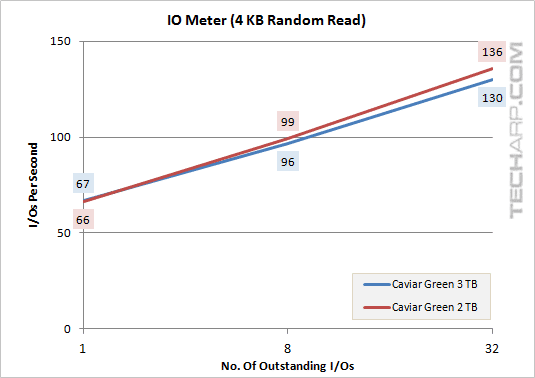
Outstanding I/Os |
Caviar Green 3 TB |
Caviar Green 2 TB |
Difference |
1 |
67 IOPS |
66 IOPS |
+ 1.0% |
8 |
96 IOPS |
99 IOPS |
- 2.9% |
32 |
130 IOPS |
136 IOPS |
- 4.0% |
4 KB Random Write
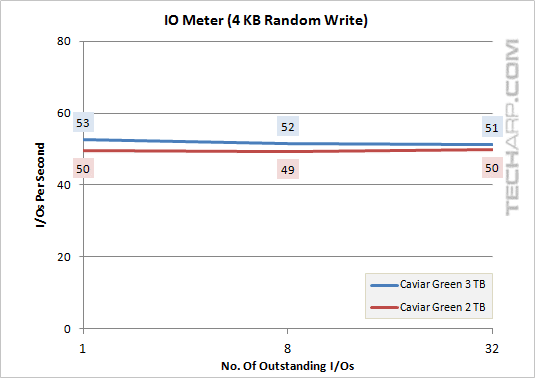
Outstanding I/Os |
Caviar Green 3 TB |
Caviar Green 2 TB |
Difference |
1 |
53 IOPS |
50 IOPS |
+ 6.3% |
8 |
52 IOPS |
49 IOPS |
+ 4.6% |
32 |
51 IOPS |
50 IOPS |
+ 3.3% |
512 KB Random Read
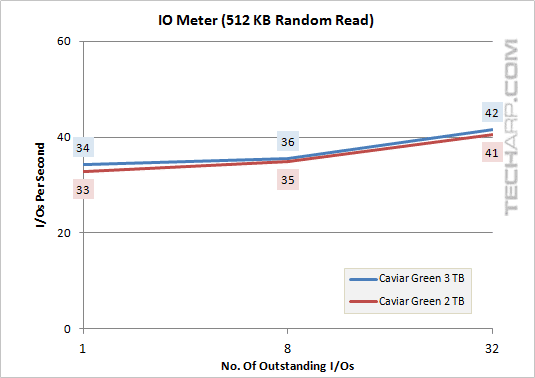
Outstanding I/Os |
Caviar Green 3 TB |
Caviar Green 2 TB |
Difference |
1 |
34 IOPS |
33 IOPS |
+ 4.4% |
8 |
36 IOPS |
35 IOPS |
+ 2.2% |
32 |
42 IOPS |
41 IOPS |
+ 2.4% |
512 KB Random Write
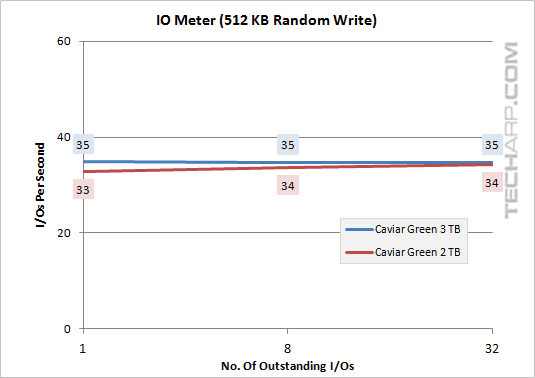
Outstanding I/Os |
Caviar Green 3 TB |
Caviar Green 2 TB |
Difference |
1 |
35 IOPS |
33 IOPS |
+ 6.3% |
8 |
35 IOPS |
34 IOPS |
+ 3.6% |
32 |
35 IOPS |
34 IOPS |
+ 1.6% |
Support Tech ARP!
If you like our work, you can help support out work by visiting our sponsors, participate in the Tech ARP Forums, or even donate to our fund. Any help you can render is greatly appreciated!
Page |
Topic |
|
1 |
||
2 |
||
3 |
• The 3 TB WD Caviar Green |
|
4 |
• HighPoint Rocket 620 SATA Controller |
|
5 |
||
6 |
• Maximum Surface Temperature |
|
7 |
||
8 |
||
9 |
||
10 |
||
11 |
||
12 |
<<< IO Meter Sequential Access Performance : Previous Page | Next Page : IOPS Scaling (Sequential Access) >>>