


 Add to Reddit

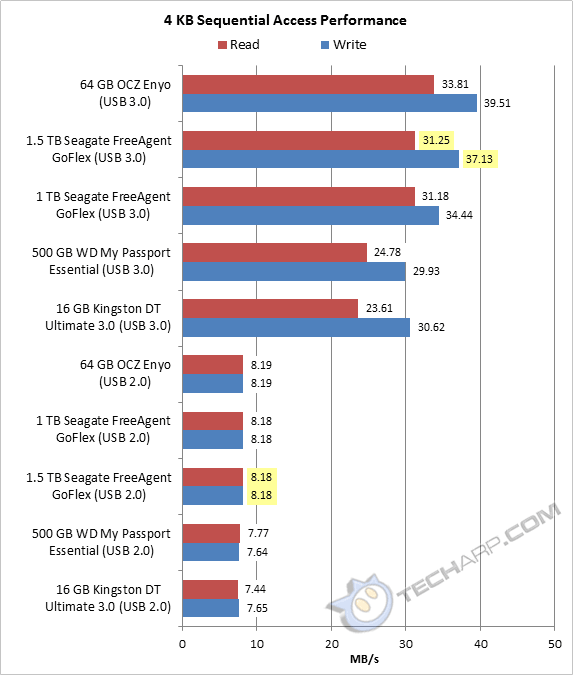
IO Meter - 4 KB Sequential Access Performance
External Drives |
Interface |
Read Speed |
Write Speed |
Average |
Difference |
64 GB OCZ Enyo |
USB 3.0 |
33.81 MB/s |
39.51 MB/s |
36.66 MB/s |
+ 7.2% |
1.5 TB Seagate FreeAgent GoFlex |
USB 3.0 |
31.25 MB/s |
37.13 MB/s |
34.19 MB/s |
Baseline |
1 TB Seagate FreeAgent GoFlex |
USB 3.0 |
31.18 MB/s |
34.44 MB/s |
32.81 MB/s |
- 4.0% |
500 GB WD My Passport Essential |
USB 3.0 |
24.78 MB/s |
29.93 MB/s |
27.36 MB/s |
- 20.0% |
16 GB Kingston DT Ultimate 3.0 |
USB 3.0 |
23.61 MB/s |
30.62 MB/s |
27.12 MB/s |
- 20.7% |
64 GB OCZ Enyo |
USB 2.0 |
8.19 MB/s |
8.19 MB/s |
8.19 MB/s |
- 76.0% |
1 TB Seagate FreeAgent GoFlex |
USB 2.0 |
8.18 MB/s |
8.18 MB/s |
8.18 MB/s |
- 76.1% |
1.5 TB Seagate FreeAgent GoFlex |
USB 2.0 |
8.18 MB/s |
8.18 MB/s |
8.18 MB/s |
- 76.1% |
500 GB WD My Passport Essential |
USB 2.0 |
7.77 MB/s |
7.64 MB/s |
7.71 MB/s |
- 77.5% |
16 GB Kingston DT Ultimate 3.0 |
USB 2.0 |
7.44 MB/s |
7.65 MB/s |
7.50 MB/s |
- 77.9% |
This is one of the two most important tests for the 1.5 TB Seagate FreeAgent GoFlex as this shows how fast it is at transferring small files. The 1.5 TB Seagate FreeAgent GoFlex was very fast at small 4 KB sequential accesses. In fact, it was just a little slower than the flash-based 64 GB OCZ Enyo. When used with a USB 2.0 port, the performance gap disappeared - the 1.5 TB FreeAgent GoFlex was as fast as the OCZ Enyo.
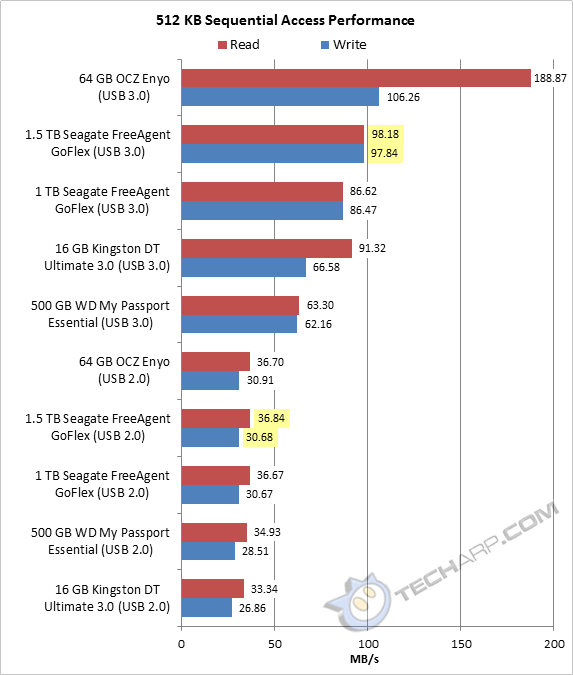
IO Meter - 512 KB Sequential Access Performance
External Drives |
Interface |
Read Speed |
Write Speed |
Average |
Difference |
64 GB OCZ Enyo |
USB 3.0 |
188.87 MB/s |
106.26 MB/s |
147.57 MB/s |
+ 50.6% |
1.5 TB Seagate FreeAgent GoFlex |
USB 3.0 |
98.18 MB/s |
97.84 MB/s |
98.01 MB/s |
Baseline |
1 TB Seagate FreeAgent GoFlex |
USB 3.0 |
86.62 MB/s |
86.47 MB/s |
86.55 MB/s |
- 11.7% |
16 GB Kingston DT Ultimate 3.0 |
USB 3.0 |
91.32 MB/s |
66.58 MB/s |
78.95 MB/s |
- 19.4% |
500 GB WD My Passport Essential |
USB 3.0 |
63.30 MB/s |
62.16 MB/s |
62.73 MB/s |
- 36.0% |
64 GB OCZ Enyo |
USB 2.0 |
36.70 MB/s |
30.91 MB/s |
33.81 MB/s |
- 65.5% |
1.5 TB Seagate FreeAgent GoFlex |
USB 2.0 |
36.84 MB/s |
30.68 MB/s |
33.76 MB/s |
- 65.6% |
1 TB Seagate FreeAgent GoFlex |
USB 2.0 |
36.67 MB/s |
30.67 MB/s |
33.67 MB/s |
- 65.6% |
500 GB WD My Passport Essential |
USB 2.0 |
34.93 MB/s |
28.51 MB/s |
31.72 MB/s |
- 67.6% |
16 GB Kingston DT Ultimate 3.0 |
USB 2.0 |
33.34 MB/s |
26.86 MB/s |
30.10 MB/s |
- 69.3% |
This is one of the two most important tests for the 1.5 TB Seagate FreeAgent GoFlex as this shows how fast it is at transferring large files. Again, the 1.5 TB FreeAgent GoFlex proved to be a very fast drive, albeit about 1/3 slower than the 64 GB OCZ Enyo. It really pays to use it with a USB 3.0 port - it is almost 3x faster in the standard USB 3.0 mode than it is in the fallback USB 2.0 mode.
Support Tech ARP!
If you like our work, you can help support out work by visiting our sponsors, participate in the Tech ARP Forums, or even donate to our fund. Any help you can render is greatly appreciated!
Page |
Topic |
|
1 |
||
2 |
||
3 |
||
4 |
||
5 |
• Testing The FreeAgent GoFlex |
|
6 |
||
7 |
||
8 |
||
9 |