


 Add to Reddit

Testing The WD Blue (WD10SPCX)
The Testbed
Processors |
|
Motherboard |
|
Memory |
Two Kingmax 2 GB DDR3-1333 modules |
Graphics Card |
|
Hard Drives |
1 TB WD Blue (WD10SPCX) |
Operating System |
Microsoft Windows 7 64-bit |
Testing Methodology
Testing Methodology
We tested in both Windows 7 and Windows Vista, with the latest updates. We chose to use IO Meter 1.1.0 RC1 as well as our "old faithful", WinBench 99 2.0, with the following tests :
- Platter Data Transfer Profile
- Business Disk WinMark 99
- High-End Disk WinMark 99
- Disk Transfer Rate (Beginning)
- Disk Transfer Rate (End)
Business Disk WinMark 99 is a real-world simulation based on three office application suites - Microsoft Office 97, Lotus SmartSuite and Corel WordPerfect Suite 8, as well as a web browser, Netscape Navigator. They are quite dated, but should still reflect the usage patterns of users in an office environment using such applications. The test runs through a script that keeps multiple applications open, while it performs tasks that switches between those applications and Netscape Navigator. The result is the average transfer rate during the script run.
High-End Disk WinMark 99 is a real-world simulation based on AVS/Express 3.4, FrontPage 98, MicroStation SE, Photoshop 4.0, Premiere 4.2, Sound Forge 4.0 and Visual C++ 5.0. However, it differs by running the applications serially, instead of simultaneously. There are individual results for each application but in this comparison, we will be looking only at the weighted average score, which is the average transfer rate during the tests.
Unfortunately, WinBench 99 seemed to have some issues with Windows Vista, or the current Vista driver for the SATA controller. It would register a SetFilePointer error in the Disk Access Time test. So, we were not able to obtain any Disk Access Time results.
Usable Capacity
) |
This 1 TB Western Digital Blue (WD10SPCX) drive officially has a formatted capacity of 1,000,204,886,016 bytes. We checked that out by formatting both in NTFS using Microsoft Windows 7.
The actual formatted capacity was 1,000,169,533,440 bytes. This is 35 MB lower than the official formatted capacity. With just over 124 MB allocated to the NTFS file system, the actual usable capacity remained slightly above 1,000 GB.
Maximum Surface Temperature
We monitored the surface temperature of six hard disk drives during their benchmarks. The following chart shows their operating temperature range, from idle to maximum load. Please note that instead of giving you the absolute numbers, we are showing the temperature delta, which is the difference between the actual temperature and the ambient room temperature.
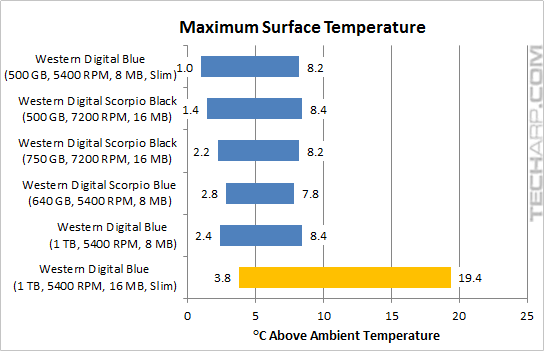
The WD10SPCX may spin at just 5400 RPM, but the PCB can actually run almost 20 °C above ambient temperature. In our average tropical temperature of 31.5 °C, that means parts of this drive can get as hot as 51 °C, and this is with the drive in the open. It will certainly run a lot hotter when installed inside a notebook, which could potentially be a problem since the drive is only rated to work in ambient temperatures of up to 60 °C.
Disk Transfer Rate
This chart shows you the range of platter-to-buffer transfer rates from the innermost track to the outermost track. In other words, it shows you the range of disk transfer rates of the hard disk drives (from minimum and maximum).
![]()
The disk transfer rate range of the slimmer WD10SPCX is virtually the same as its heftier brother, the WD10JPVT. This is because these two 1 TB WD Blue models sport the same 500 GB platters. It is also close to the transfer rate range of the WD5000LPVT, which also uses the same 500 GB platter.
Note how the use of high density 500 GB platters allow these 5,400 RPM drives to beat 7,200 RPM drives like the 500 GB Scorpio Black (WD5000BEKT) that use lower density 250 GB platters.
Platter Data Transfer Profile
We compared the platter profile of the 1 TB WD Blue Slim (WD10SPCX) to those of the 1 TB WD Blue (WD10JPVT), the 640 GB Blue (WD6400BEVT) and the 500 GB WD Blue Slim (WD5000LPVT). With the exception of the WD6400BEVT which uses lower-density 320 GB platters, the other drives sport high-density 500 GB platters.
)
The maximum platter transfer rate appeared to be about 120 MB/s which progressively dropped across the platter to about 57 MB/s at the last track. The platter quality seems to be average in this sample, with 16 visible dips which suggest the use of replacement sectors.
Although the 500 GB WD Blue Slim started off a little faster than the 1 TB WD Blue Slim, its transfer rate fell rapidly, with the WD10SPCX being much faster from about 80 GB onwards.
| If you like this article, please share it! -> |
Support Tech ARP!
If you like our work, you can help support out work by visiting our sponsors, participate in the Tech ARP Forums, or even donate to our fund. Any help you can render is greatly appreciated!
<<< The WD10SPCX, AF Technology, Connectors & Breather Hole, Peeking Under the PCB : Previous Page | Next Page : WinBench 99 Results >>>
Support us by buying from Amazon.com! |
|
| Grab a FREE 30-day trial of Amazon Prime for free shipping, instant access to 40,000 movies and TV episodes and the Kindle Owners' Lending Library! | |