


 Add to Reddit

IO Meter
We compared the 4 TB Western Digital Blue (WD40E31X) SSHD to the 4 TB Western Digital Red (WD40EFRX). For more performance comparisons, please take a look at The Hard Disk Drive Performance Comparison Guide.
| If you like this article, please share it! -> |
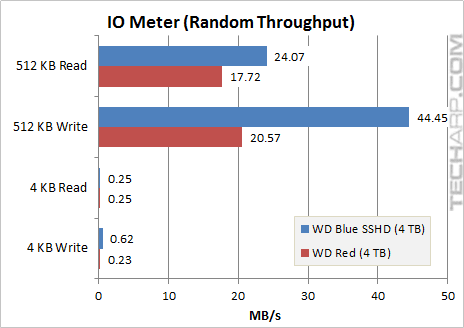
Throughput (Random Access)
Test |
WD Blue SSHD |
WD Red |
Difference |
512 KB Read |
24.07 MB/s |
17.72 MB/s |
+ 35.8% |
512 KB Write |
44.45 MB/s |
20.57 MB/s |
+ 116.1% |
4 KB Read |
0.25 MB/s |
0.25 MB/s |
- |
4 KB Write |
0.62 MB/s |
0.23 MB/s |
+ 169.6% |
The small random reads and writes are the most important tests for applications that make a lot of random accesses, so those would be key performance indicators for drives that are used as boot or system drives, but not very important for NAS or media storage drives.
The 4 TB Western Digital Blue SSHD was a LOT faster than the 4 TB Western Digital Red, especially in random writes. It enjoyed a significant boost in its large read speed but none in small random reads. It's fascinating to see how a small 8 GB flash cache can improve write performance so much.
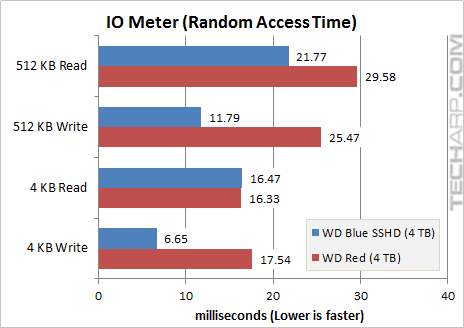
Random Access Time
Test |
WD Blue SSHD |
WD Red |
Difference |
512 KB Read |
21.77 ms |
29.58 ms |
- 26.4% |
512 KB Write |
11.79 ms |
25.47 ms |
- 53.7% |
4 KB Read |
16.47 ms |
16.33 ms |
+ 0.8% |
4 KB Write |
6.65 ms |
17.54 ms |
- 62.1% |
The significantly lower random access time was entirely due to the flash memory cache, because the 4 TB Western Digital Blue SSHD uses the same platter (with the same areal density) as the 4 TB Western Digital Red.
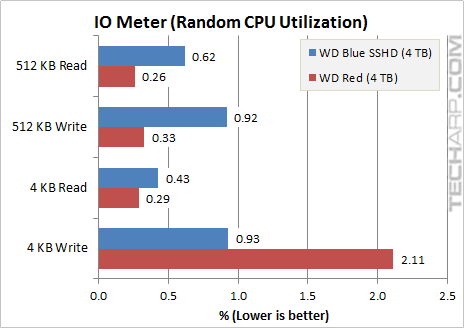
CPU Utilization (Random Access)
Test |
WD Blue SSHD |
WD Red |
Difference |
512 KB Read |
0.62% |
0.26% |
+ 138.5% |
512 KB Write |
0.92% |
0.33% |
+ 178.8% |
4 KB Read |
0.43% |
0.29% |
+ 48.3% |
4 KB Write |
0.93% |
2.11% |
- 55.9% |
Although we generally don't bother much about CPU utilization in the age of quad-core processors, it's interesting to note that the 4 TB Western Digital Blue SSHD uses 2-3x more CPU time than the 4 TB Western Digital Red.
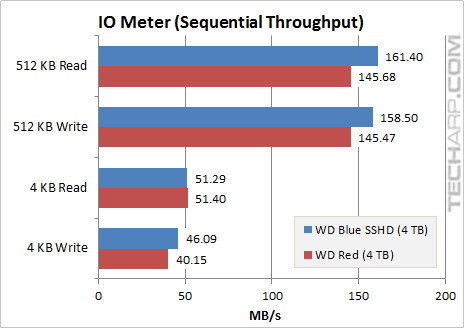
Throughput (Sequential Access)
Test |
WD Blue SSHD |
WD Red |
Difference |
512 KB Read |
161.40 MB/s |
145.68 MB/s |
+ 10.8% |
512 KB Write |
158.50 MB/s |
145.47 MB/s |
+ 9.0% |
4 KB Read |
51.29 MB/s |
51.40 MB/s |
- 0.2% |
4 KB Write |
46.09 MB/s |
40.15 MB/s |
+ 14.8% |
These are the second most important tests for boot drives, and the most important tests for secondary storage drives. The large sequential transfer performance is particularly important because they are often used to store large game or media files, which are all practically larger than than 512 KB these days.
It comes to no surprise that the 4 TB Western Digital Blue SSHD is faster than the 4 TB Western Digital Red. However, the performance advantage is much smaller when it came to sequential accesses. This is likely due to the relatively limited performance of the 4-channel JMF608 flash controller, which is limited to 150 MB/s (read) and 100 MB/s (write).
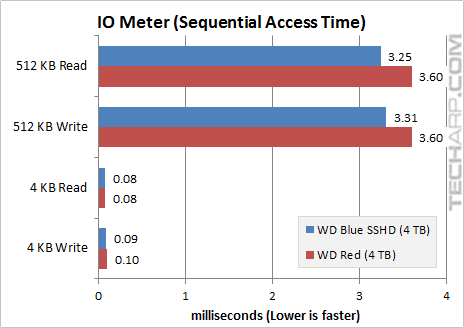
Sequential Access Time
Test |
WD Blue SSHD |
WD Red |
Difference |
512 KB Read |
3.25 ms |
3.60 ms |
- 9.8% |
512 KB Write |
3.31 ms |
3.60 ms |
- 8.1% |
4 KB Read |
0.08 ms |
0.08 ms |
- 0.9% |
4 KB Write |
0.09 ms |
0.10 ms |
- 11.7% |
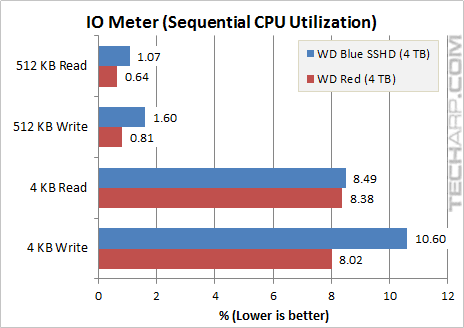
CPU Utilization (Sequential Access)
Test |
WD Blue SSHD |
WD Red |
Difference |
512 KB Read |
1.07% |
0.64% |
+ 67.2% |
512 KB Write |
1.60% |
0.81% |
+ 97.5% |
4 KB Read |
8.49% |
8.38% |
+ 1.3% |
4 KB Write |
10.60% |
8.02% |
+ 32.2% |
Even when it comes to sequential accesses, the 4 TB Western Digital Blue SSHD still used a lot more CPU time than the 4 TB Western Digital Red. But the difference is much smaller, not that it really matters with high-performance processors we use today.
Support Tech ARP!
If you like our work, you can help support out work by visiting our sponsors, participate in the Tech ARP Forums, or even donate to our fund. Any help you can render is greatly appreciated!
Page |
4 TB Western Digital Blue SSHD Review |
|
1 |
||
2 |
||
3 |
||
4 |
• Testing The 4 TB WD Blue SSHD |
|
5 |
• Transfer Rate Range, Platter Profile |
|
6 |
||
7 |
||
8 |
||
9 |
Support us by buying from Amazon.com! |
|
| Grab a FREE 30-day trial of Amazon Prime for free shipping, instant access to 40,000 movies and TV episodes and the Kindle Owners' Lending Library! | |
<<< Transfer Rate Range, Platter Profile, WinBench 99 Test Results : Previous Page | Next Page : IOPS Scaling (Random Access) >>>