


 Add to Reddit

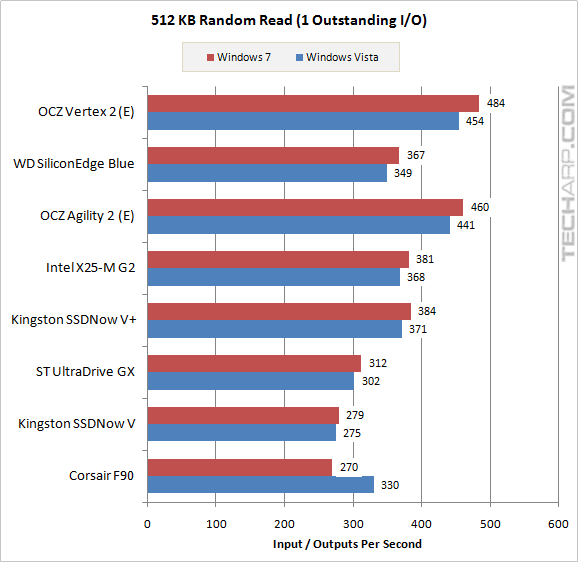
IOPS Scaling - 512 KB Random Read
1 Outstanding I/O
Solid State Drive |
Windows 7 |
Windows Vista |
Difference |
OCZ Vertex 2 (E) |
484 IOPS |
454 IOPS |
+ 6.6% |
Western Digital SiliconEdge Blue |
367 IOPS |
349 IOPS |
+ 5.2% |
OCZ Agility 2 (E) |
460 IOPS |
441 IOPS |
+ 4.4% |
Intel X25-M G2 (34 nm) |
381 IOPS |
368 IOPS |
+ 3.6% |
Kingston SSDNow V+ (Gen. 2) |
384 IOPS |
371 IOPS |
+ 3.6% |
Super Talent UltraDrive GX |
312 IOPS |
302 IOPS |
+ 3.3% |
Kingston SSDNow V (Gen. 2) |
279 IOPS |
275 IOPS |
+ 1.6% |
Corsair F90 |
270 IOPS |
330 IOPS |
- 18.4% |
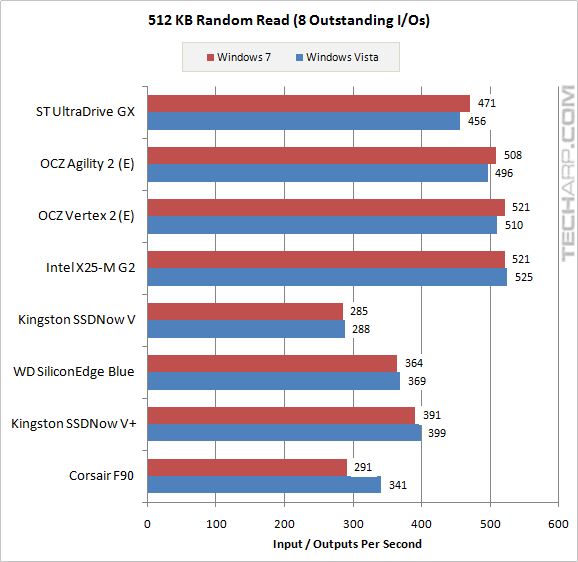
8 Outstanding I/Os
Solid State Drive |
Windows 7 |
Windows Vista |
Difference |
Super Talent UltraDrive GX |
471 IOPS |
456 IOPS |
+ 3.2% |
OCZ Agility 2 (E) |
508 IOPS |
496 IOPS |
+ 2.5% |
OCZ Vertex 2 (E) |
521 IOPS |
510 IOPS |
+ 2.1% |
Intel X25-M G2 (34 nm) |
521 IOPS |
525 IOPS |
- 0.7% |
Kingston SSDNow V (Gen. 2) |
285 IOPS |
288 IOPS |
- 0.9% |
Western Digital SiliconEdge Blue |
364 IOPS |
369 IOPS |
- 1.3% |
Kingston SSDNow V+ (Gen. 2) |
391 IOPS |
399 IOPS |
- 2.0% |
Corsair F90 |
291 IOPS |
341 IOPS |
- 14.8% |
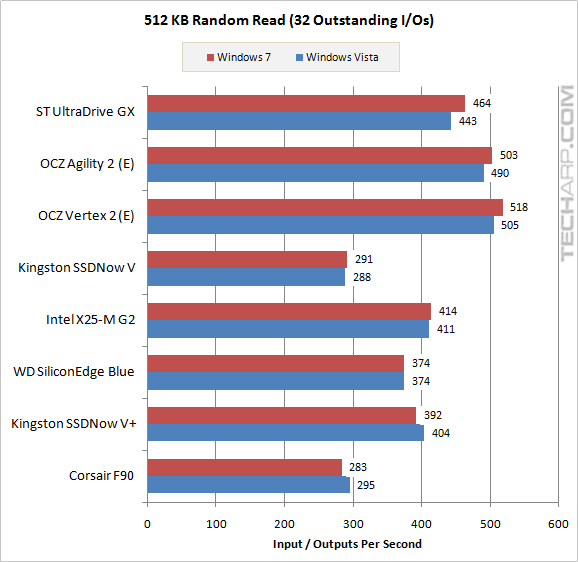
32 Outstanding I/Os
Solid State Drive |
Windows 7 |
Windows Vista |
Difference |
Super Talent UltraDrive GX |
464 IOPS |
443 IOPS |
+ 4.6% |
OCZ Agility 2 (E) |
503 IOPS |
490 IOPS |
+ 2.6% |
OCZ Vertex 2 (E) |
518 IOPS |
505 IOPS |
+ 2.6% |
Kingston SSDNow V (Gen. 2) |
291 IOPS |
288 IOPS |
+ 1.0% |
Intel X25-M G2 (34 nm) |
414 IOPS |
411 IOPS |
+ 0.6% |
Western Digital SiliconEdge Blue |
374 IOPS |
374 IOPS |
- |
Kingston SSDNow V+ (Gen. 2) |
392 IOPS |
404 IOPS |
- 2.8% |
Corsair F90 |
283 IOPS |
295 IOPS |
- 4.2% |
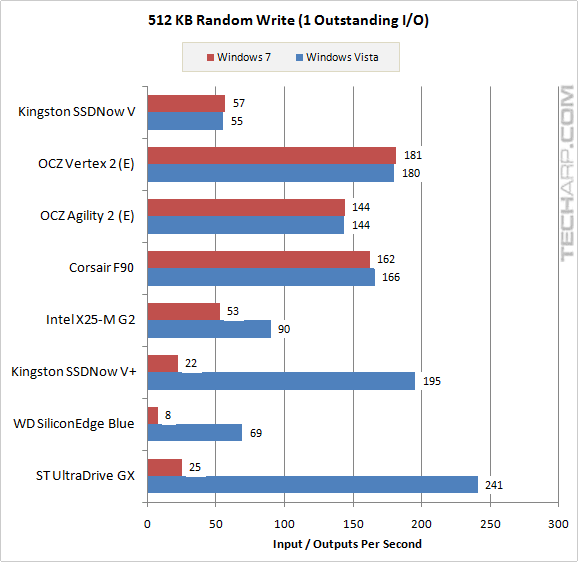
IOPS Scaling - 512 KB Random Write
1 Outstanding I/O
Solid State Drive |
Windows 7 |
Windows Vista |
Difference |
Kingston SSDNow V (Gen. 2) |
57 IOPS |
55 IOPS |
+ 2.7% |
OCZ Vertex 2 (E) |
181 IOPS |
180 IOPS |
+ 0.7% |
OCZ Agility 2 (E) |
144 IOPS |
144 IOPS |
+ 0.2% |
Corsair F90 |
162 IOPS |
166 IOPS |
- 2.0% |
Intel X25-M G2 (34 nm) |
53 IOPS |
90 IOPS |
- 41.5% |
Kingston SSDNow V+ (Gen. 2) |
22 IOPS |
195 IOPS |
- 88.6% |
Western Digital SiliconEdge Blue |
8 IOPS |
69 IOPS |
- 89.0% |
Super Talent UltraDrive GX |
25 IOPS |
241 IOPS |
- 89.7% |
8 Outstanding I/Os
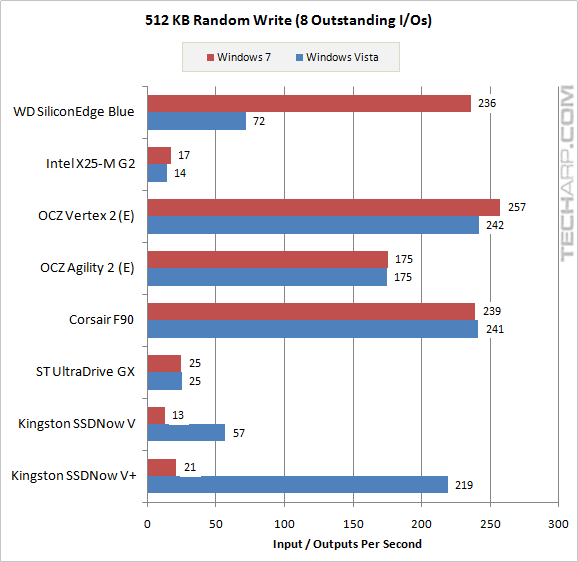
Solid State Drive |
Windows 7 |
Windows Vista |
Difference |
Western Digital SiliconEdge Blue |
219 IOPS |
21 IOPS |
+ 229.5% |
Intel X25-M G2 (34 nm) |
57 IOPS |
13 IOPS |
+ 19.8% |
OCZ Vertex 2 (E) |
25 IOPS |
25 IOPS |
+ 6.5% |
OCZ Agility 2 (E) |
175 IOPS |
175 IOPS |
+ 0.5% |
Corsair F90 |
239 IOPS |
241 IOPS |
- 1.0% |
Super Talent UltraDrive GX |
242 IOPS |
257 IOPS |
- 1.0% |
Kingston SSDNow V (Gen. 2) |
14 IOPS |
17 IOPS |
- 77.3% |
Kingston SSDNow V+ (Gen. 2) |
72 IOPS |
236 IOPS |
- 90.3% |
32 Outstanding I/Os
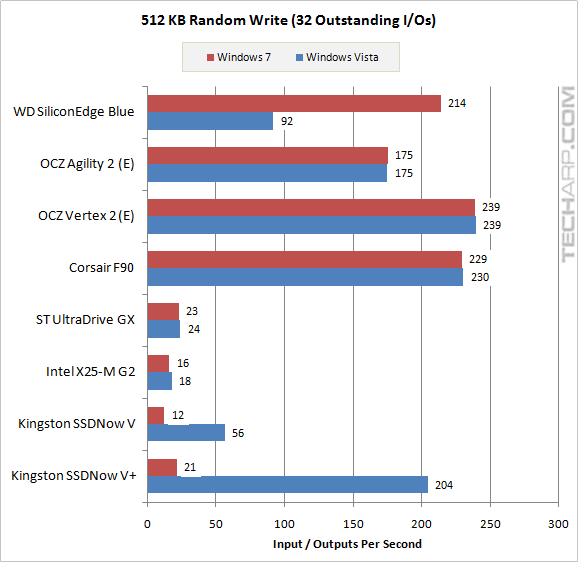
Solid State Drive |
Windows 7 |
Windows Vista |
Difference |
Western Digital SiliconEdge Blue |
214 IOPS |
92 IOPS |
+ 133.0% |
OCZ Agility 2 (E) |
175 IOPS |
175 IOPS |
+ 0.3% |
OCZ Vertex 2 (E) |
239 IOPS |
239 IOPS |
- 0.2% |
Corsair F90 |
229 IOPS |
230 IOPS |
- 0.5% |
Super Talent UltraDrive GX |
23 IOPS |
24 IOPS |
- 5.4% |
Intel X25-M G2 (34 nm) |
16 IOPS |
18 IOPS |
- 11.0% |
Kingston SSDNow V (Gen. 2) |
12 IOPS |
56 IOPS |
- 78.1% |
Kingston SSDNow V+ (Gen. 2) |
21 IOPS |
204 IOPS |
- 89.5% |
Support Tech ARP!
If you like our work, you can help support out work by visiting our sponsors, participate in the Tech ARP Forums, or even donate to our fund. Any help you can render is greatly appreciated!
Introduction |
||
| Transfer Rate & Access Time |
||
| IOPS Scaling | ||
Conclusion |
<<< 4 KB Random Read + Write IOPS Scaling : Previous Page | Next Page : 4 KB Sequential Read + Write IOPS Scaling >>>