How Long Does It Really Take To Break-In The Arctic Silver 5 Thermal Paste?
According to Arctic Silver, up to 200 hours of break-in time is required for the Arctic Silver 5 thermal paste to "cure" and its performance to stabilize. That sounds like an extraordinarily long time for thermal paste to set, so Graysky tested this claim to the full 200 hours and this article will present his full findings. But first, let's take a look at how his test was set-up.
![]()
What's The Break-In Period? Due to the unique carrier fluid used and the shapes and sizes of the thermally conductive particles in Arctic Silver's thermal compounds it will take multiple thermal cycles to achieve maximum particle to particle thermal conduction and for the heatsink to metal cap interface to reach maximum conductivity. This period will be longer in a system without a fan on the heatsink. On systems measuring actual internal core temperatures via the CPU's internal diode, the measured temperature will often drop slightly to significantly over this "break-in" period. This break-in will occur during the normal use of the computer as long as the computer is turned off from time to time and the interface is allowed to cool. The Arctic Silver 5's rated break-in period is 200 hours, during which the CPU temperature will drop several degrees as measured with the thermal diode in the hottest part of the CPU core. |
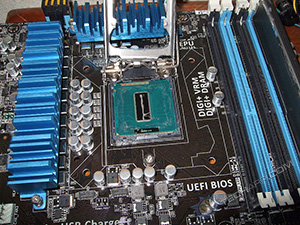
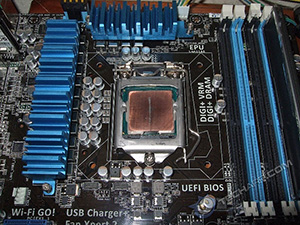
A delidded Intel Core i7-3770K processor (overclocked to 100 MHz x 44 with fixed vcore) was treated with a fresh line of AS5 both under and above the IHS, as recommended by Arctic Silver for Intel Ivy Bridge processors.
The Intel stock cooler was then attached, and the system stressed using either mprime (prime95 for Linux) and burnP6 immediately after the cooler was installed to establish the baseline (time = 0 steady state temperature for each stresser.
Core temperatures, vcore and CPU fan RPMs were measured using a a simple shell script harvesting the Linux kernel's lm_sensors readings. Ambient temperature was also recorded using the average of two external thermometers.
 |
 |
Once the baseline temps were established, the experiment was conducted as follows :
-
The stress tests were repeated every 2 hours for several days. This means 42 minutes of stress (12 mins. for burnP6 and 30 mins. for mprime) followed by 78 minutes of idle all day, every day for 3 days.
-
The interval was then lengthened to once every 4 hours (42 mins. of stress, 198 mins. of idle) for a few days.
-
Finally, the interval was lengthened to once every 6 hours (42 mins. of stress, 318 mins. of idle) for the rest of the experiment.
The resulting data were normalized to the average readings for the initial run, in order to study the temperature decrease and rate of decrease.
mprime version 28.5 x86_64 ran with 8 threads performing a FFT of size 440k. cpuburnP6 had no settings but 8 independent copies of it ran at the same time so all cores would be stressed equally.
The Tech ARP 2014 Mega Giveaway Contest
| If you like this article, please share it! -> |
Calculating Zero
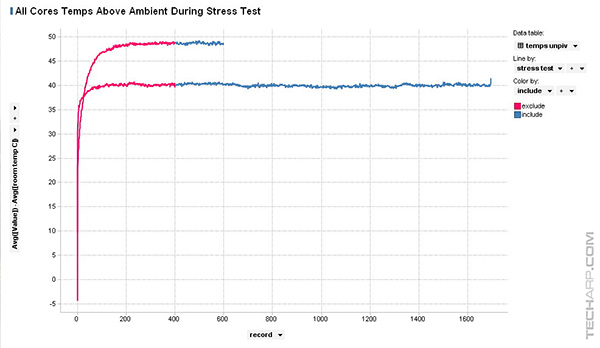
![]() Zero was calculated simply by stressing with the program (either mprime or burnP6) and waiting for the temperature to stabilize. In the plot of core temperature adjusted for ambient vs. time (in seconds), the pink color indicates data points I excluded since the CPU was coming up to temperature, while the blue color denotes datapoints that were included.
Zero was calculated simply by stressing with the program (either mprime or burnP6) and waiting for the temperature to stabilize. In the plot of core temperature adjusted for ambient vs. time (in seconds), the pink color indicates data points I excluded since the CPU was coming up to temperature, while the blue color denotes datapoints that were included.
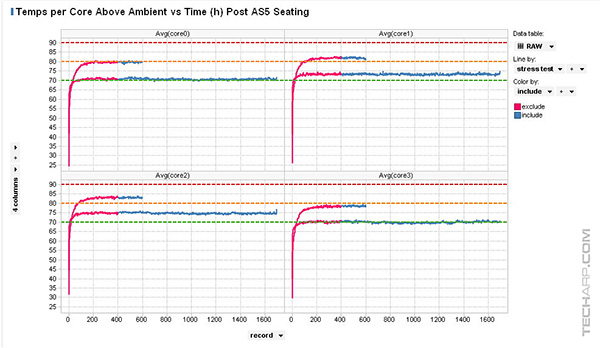
The higher temperature / shorter line is the temperature profile for burnP6 and the lower temperature / l onger line is the profile for the mprime run. Basically, cpuburnP6 ran for 12 minutes and mprime for 30 minutes, with the first 400 seconds excluded from their results. The second plot just shows the same data before normalization for ambient temperature, and split out by individual core :
AV-optimized hard disk drives are safe to use
| If you like this article, please share it! -> |
The Results
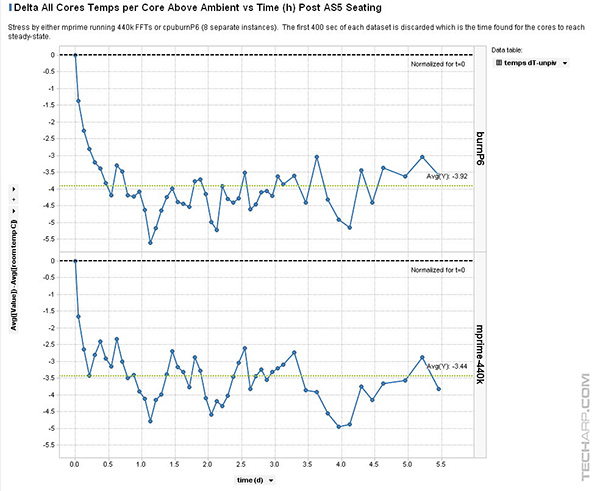
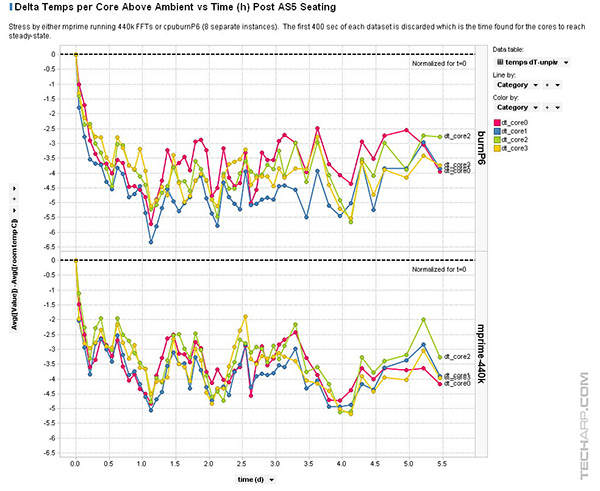
In these two charts, the plots are of the time since the cooler was seated (days) vs. the delta temperature above ambient, "dT". Initially, they ran every 2 hours, but after 3 days or so, the interval was lengthened to every 4 hours, and finally to every 6 hours until approximately 200 hours had elapsed.
Both stress programs gave similar results with the average temperature drop occurring sometime around 8 hours and stabilizing around 3-4 degrees lower than the initially measured temperature. The first plot shows the average of all cores, while the second plot shows the results for the individual cores.
Should you select MBR or GPT when you install a new drive?
| If you like this article, please share it! -> |
Conclusion
The CPU temperature basically stabilized after 8 hours, not 200 hours as Arctic Silver claimed. In other words, the Arctic Silver 5 thermal paste only requires 8 hours to cure. The drop in CPU temperature was pretty good at 3-4 °C relative to the initial temperature, depending on the stress method used.
How general is this result? I can only report these data and draw a conclusion based on them. The hallmark of a scientific experiment is a reproducible outcome. I realize this is just an n of 1. but I don't have the time or inclination to repeat it. Perhaps others will do it and report back. Feel free to post in this thread if you do.
The ultimate camera lens buying guide
| If you like this article, please share it! -> |
Data Tables
The data table generated by the script above is available in csv format. A more elaborated table where I performed some calculations needed for the plots (difference from ambient temperature, which points are included or excluded, average for time=0 for each stresser, etc.) is also available in csv format should you wish to plot anything yourself.
Learn how to optimize your SSD
| If you like this article, please share it! -> |
Support Tech ARP!
If you like our work, you can help support out work by visiting our sponsors, participate in the Tech ARP Forums, or even donate to our fund. Any help you can render is greatly appreciated!
Support us by buying from Amazon.com! |
|
| Grab a FREE 30-day trial of Amazon Prime for free shipping, instant access to 40,000 movies and TV episodes and the Kindle Owners' Lending Library! | |
Questions & Comments
If you have a question or comment on this editorial, please feel free to post them here!
Date |
Revision |
Revision History |
| 04-12-2014 | 1.0 |
Initial Release. |
| 08-12-2014 | 2.0 |
Added the results for the full 200 hour test. |


 Add to Reddit

