


 Add to Reddit

IOPS Scaling (Random)
In these tests, we tested the drive's ability to tackle multiple input/output operations. We compared the 240 GB HyperX Savage SSD to the industry standard - the Intel 520 Series SSD. If you wish to see how the HyperX Savage compares to other solid state drives, take a look at our Solid State Drive Performance Comparison Guide, which we will be updating shortly.
The Phison PS3110 controller's emphasis on flash management appears to sacrifice a little performance when handling single operations but conversely deliver much better performance with multiple, simultaneous operations. It is optimized for large random accesses at the expense of small random accesses, with a tremendous advantage in large write speed.
| If you like this article, please share it! -> |
4 KB Random Read
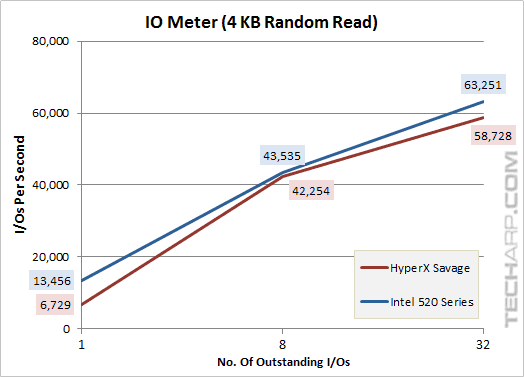
Outstanding I/Os |
HyperX Savage |
Intel 520 Series |
Difference |
1 |
6,729 IOPS |
13,456 IOPS |
- 50.0% |
8 |
42,254 IOPS |
43,535 IOPS |
- 2.9% |
32 |
58,728 IOPS |
63,251 IOPS |
- 7.2% |
4 KB Random Write
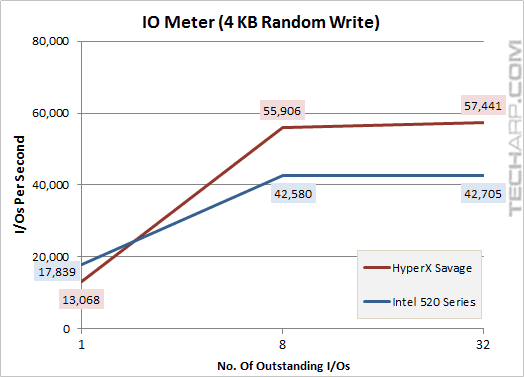
Outstanding I/Os |
HyperX Savage |
Intel 520 Series |
Difference |
1 |
13,068 IOPS |
17,839 IOPS |
- 26.7% |
8 |
55,906 IOPS |
42,580 IOPS |
+ 31.3% |
32 |
57,441 IOPS |
48,458 IOPS |
+ 34.5% |
512 KB Random Read
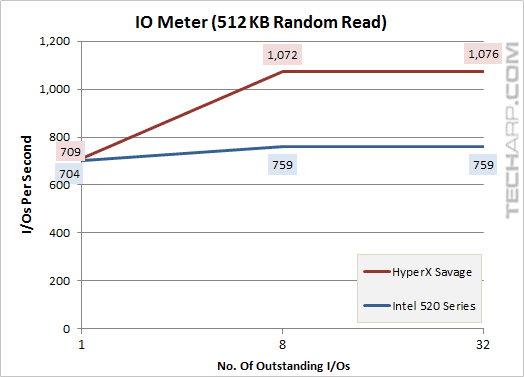
Outstanding I/Os |
HyperX Savage |
Intel 520 Series |
Difference |
1 |
709 IOPS |
704 IOPS |
+ 0.7% |
8 |
1,072 IOPS |
759 IOPS |
+ 41.2% |
32 |
1,076 IOPS |
759 IOPS |
+ 41.8% |
512 KB Random Write
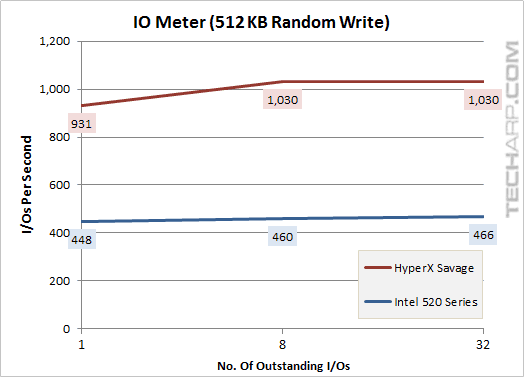
Outstanding I/Os |
HyperX Savage |
Intel 520 Series |
Difference |
1 |
931 IOPS |
448 IOPS |
+ 107.9% |
8 |
1,030 IOPS |
460 IOPS |
+ 123.9% |
32 |
1,030 IOPS |
466 IOPS |
+ 120.9% |
Support Tech ARP!
If you like our work, you can help support out work by visiting our sponsors, participate in the Tech ARP Forums, or even donate to our fund. Any help you can render is greatly appreciated!
Page |
240 GB HyperX Savage SSD Review |
|
1 |
||
2 |
• The 240 GB HyperX Savage SSD |
|
3 |
• USB 3.0 Enclosure, Bracket & Spacer |
|
4 |
• Testing The 240 GB HyperX Savage |
|
5 |
||
6 |
||
7 |
||
8 |
||
9 |
||
10 |
||
11 |
Support us by buying from Amazon.com! |
|
| Grab a FREE 30-day trial of Amazon Prime for free shipping, instant access to 40,000 movies and TV episodes and the Kindle Owners' Lending Library! | |