


 Add to Reddit

IOPS Scaling
In these tests, we tested the drive's ability to tackle multiple input/output operations. Again, we compared the OCZ RevoDrive to the OCZ Vertex 2 (E). If you wish to see how the OCZ RevoDrive compares to other solid state drives, take a look at our Solid State Drive Performance Comparison Guide.
Do note that these results are based on the average of separate tests using compressible and non-compressible data. This is to address the fact the newer SSD controllers like the SandForce SF-1222 compress data for better performance and lower wear on the memory cells.
4 KB Sequential Read
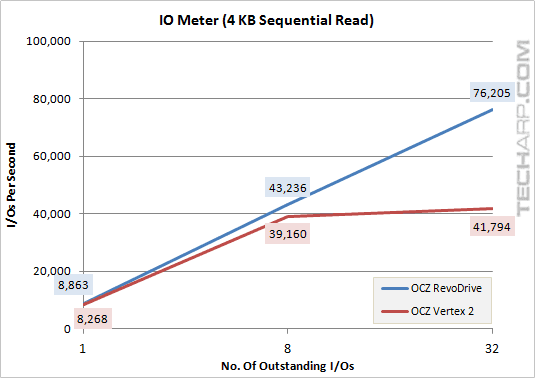
Outstanding I/Os |
OCZ RevoDrive |
OCZ Vertex 2 (E) |
Difference |
1 |
10,403 IOPS |
10,161 IOPS |
+ 2.4% |
8 |
46,486 IOPS |
39,479 IOPS |
+ 17.7% |
32 |
77,315 IOPS |
43,965 IOPS |
+ 75.9% |
4 KB Sequential Write
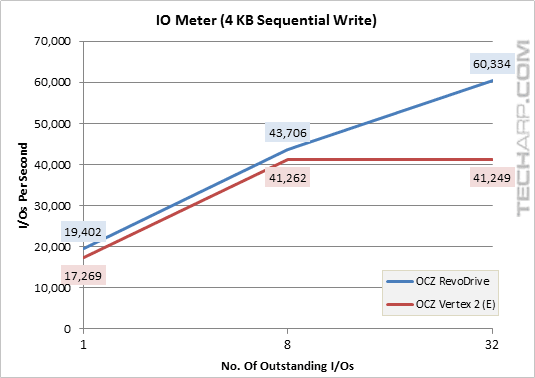
Outstanding I/Os |
OCZ RevoDrive |
OCZ Vertex 2 (E) |
Difference |
1 |
19,402 IOPS |
17,269 IOPS |
+ 12.4% |
8 |
43,706 IOPS |
41,262 IOPS |
+ 5.9% |
32 |
60,334 IOPS |
41,249 IOPS |
+ 46.3% |
512 KB Sequential Read
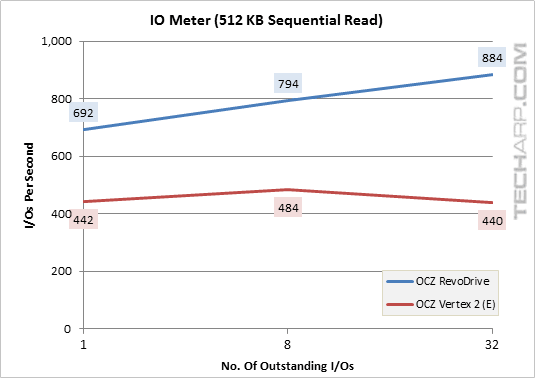
Outstanding I/Os |
OCZ RevoDrive |
OCZ Vertex 2 (E) |
Difference |
1 |
692 IOPS |
442 IOPS |
+ 56.4% |
8 |
794 IOPS |
484 IOPS |
+ 64.2% |
32 |
884 IOPS |
440 IOPS |
+ 101.0% |
512 KB Sequential Write
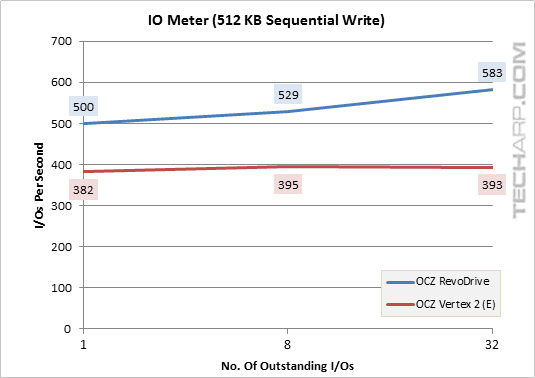
Outstanding I/Os |
OCZ RevoDrive |
OCZ Vertex 2 (E) |
Difference |
1 |
500 IOPS |
382 IOPS |
+ 31.0% |
8 |
529 IOPS |
395 IOPS |
+ 33.9% |
32 |
583 IOPS |
393 IOPS |
+ 48.2% |
Support Tech ARP!
If you like our work, you can help support out work by visiting our sponsors, participate in the Tech ARP Forums, or even donate to our fund. Any help you can render is greatly appreciated!
Page |
Topic |
|
1 |
|
|
2 |
||
3 |
||
4 |
||
5 |
||
6 |
||
7 |
||
8 |
||
9 |
||
10 |
||
11 |
||
12 |
||
13 |
||
14 |
||