


 Add to Reddit

WinBench 99 2.0
For ease of comparison, we colour-coded the bars according to the drive type. 3.5" desktop hard disk drives have bars that are blue in colour, while 2.5" mobile hard disk drives have bars that are red in colour.
Business Disk WinBench 99
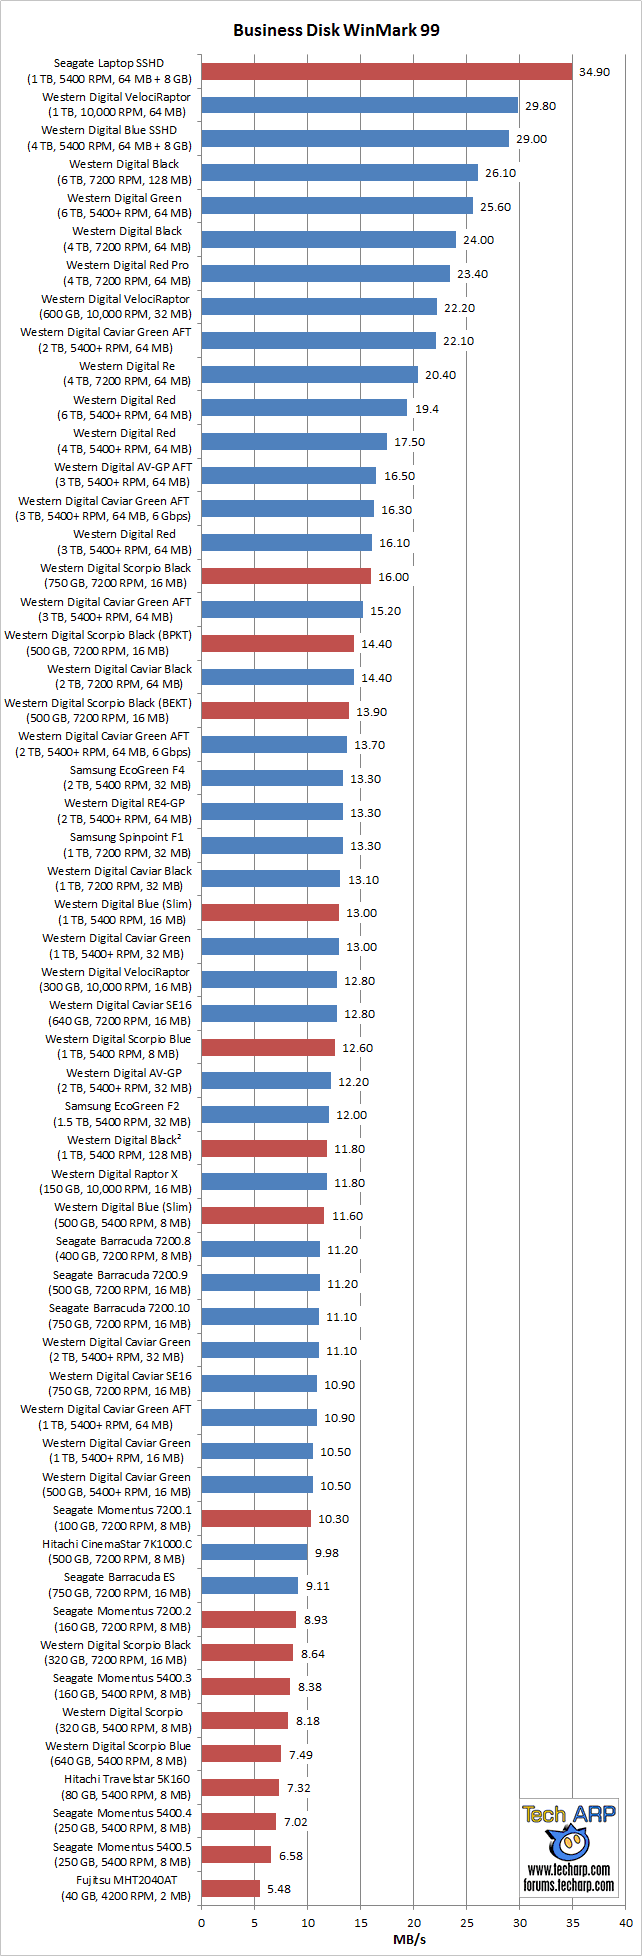
Top 5 Desktop Drives |
Capacity |
Business Disk |
Difference |
Useful Links |
1 TB |
29.80 MB/s |
Baseline |
||
4 GB |
29.00 MB/s |
- 2.7% |
||
6 TB |
26.10 MB/s |
- 12.4% |
||
6 TB |
25.60 MB/s |
- 14.1% |
||
4 TB |
24.00 MB/s |
- 19.5% |
||
Top 5 Mobile Drives |
Capacity |
Business Disk |
Difference |
Useful Links |
1 TB |
34.90 MB/s |
Baseline |
||
750 GB |
16.00 MB/s |
- 54.2% |
||
500 GB |
14.40 MB/s |
- 58.7% |
||
500 GB |
13.90 MB/s |
- 60.2% |
||
1 TB |
13.00 MB/s |
- 62.8% |
||
| If you like this article, please share it! -> |
High-End Disk WinBench 99
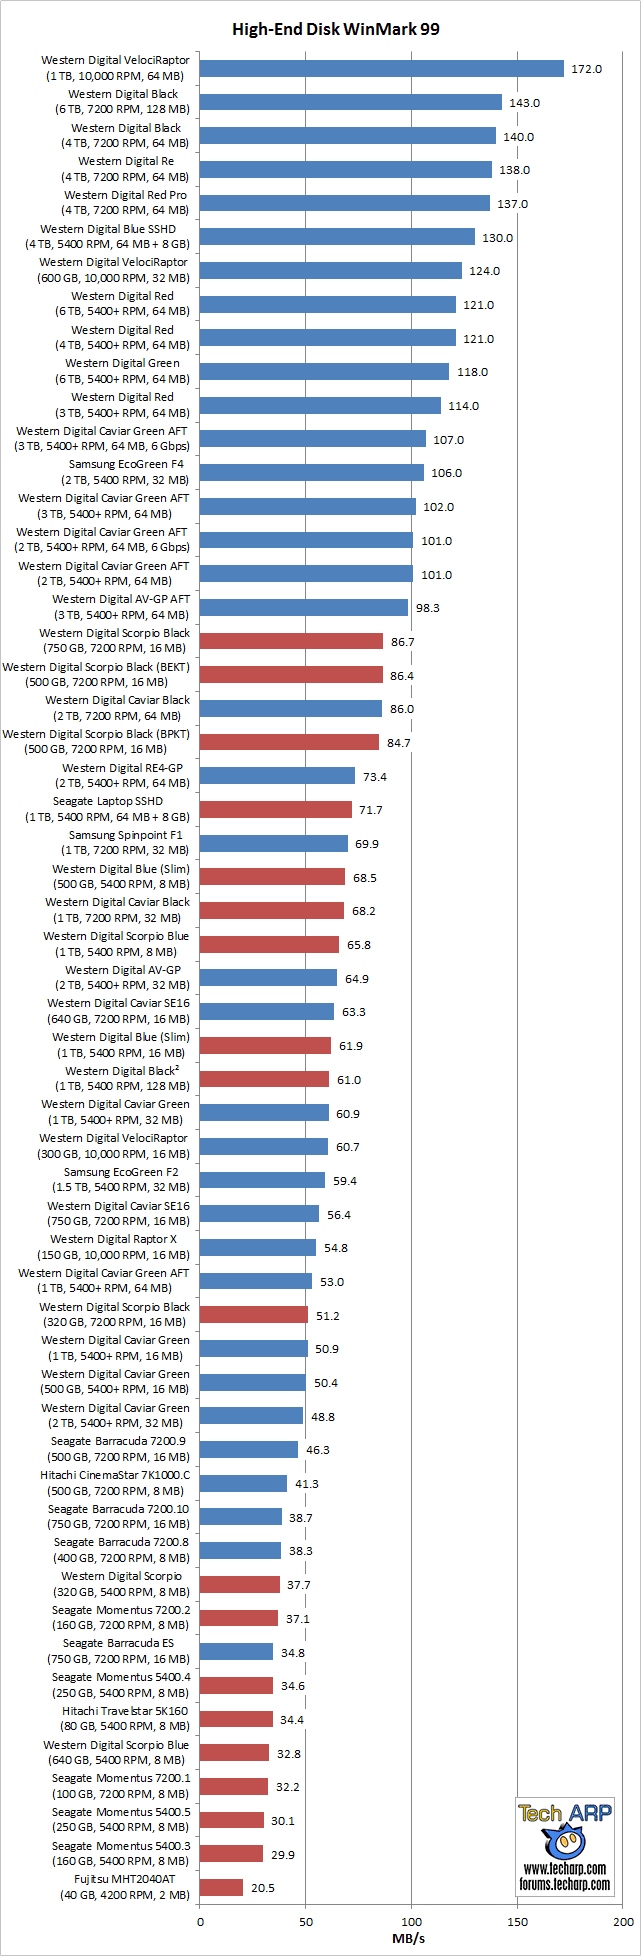
Top 5 Desktop Drives |
Capacity |
High-End Disk |
Difference |
Useful Links |
1 TB |
172.0 MB/s |
Baseline |
||
6 TB |
143.0 MB/s |
- 16.9% |
||
4 TB |
140.0 MB/s |
- 18.6% |
||
4 TB |
138.0 MB/s |
- 19.8% |
||
4 TB |
137.0 MB/s |
- 20.3% |
||
Top 5 Mobile Drives |
Capacity |
High-End Disk |
Difference |
Useful Links |
750 GB |
86.7 MB/s |
Baseline |
||
500 GB |
86.4 MB/s |
- 0.3% |
||
500 GB |
84.7 MB/s |
- 2.3% |
||
1 TB |
71.7 MB/s |
- 17.3% |
||
500 GB |
68.5 MB/s |
- 21.0% |
||
| If you like this article, please share it! -> |
Support Tech ARP!
If you like our work, you can help support out work by visiting our sponsors, participate in the Tech ARP Forums, or even donate to our fund. Any help you can render is greatly appreciated!
Details & Settings |
• Introduction |
|
| Real World Simulations | ||
|
||
Synthetic Tests |
||
|
||
|
||
|
||
Conclusion |
<<< Introduction, The Hard Disk Drives, Testbed & Methodology : Previous Page | Next Page : Maximum Surface Temperature, Disk Transfer Rate >>>
Support us by buying from Amazon.com! |
|
| Grab a FREE 30-day trial of Amazon Prime for free shipping, instant access to 40,000 movies and TV episodes and the Kindle Owners' Lending Library! | |