


 Add to Reddit

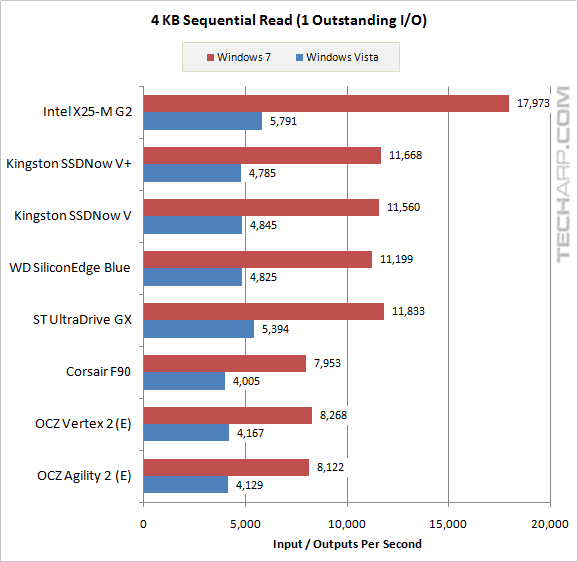
IOPS Scaling - 4 KB Sequential Read
1 Outstanding I/O
Solid State Drive |
Windows 7 |
Windows Vista |
Difference |
Intel X25-M G2 (34 nm) |
17,973 IOPS |
5,791 IOPS |
+ 210.4% |
Kingston SSDNow V+ (Gen. 2) |
11,668 IOPS |
4,785 IOPS |
+ 143.8% |
Kingston SSDNow V (Gen. 2) |
11,560 IOPS |
4,845 IOPS |
+ 138.6% |
Western Digital SiliconEdge Blue |
11,199 IOPS |
4,825 IOPS |
+ 132.1% |
Super Talent UltraDrive GX |
11,833 IOPS |
5,394 IOPS |
+ 119.4% |
Corsair F90 |
7,953 IOPS |
4,005 IOPS |
+ 98.6% |
OCZ Vertex 2 (E) |
8,268 IOPS |
4,167 IOPS |
+ 98.4% |
OCZ Agility 2 (E) |
8,122 IOPS |
4,129 IOPS |
+ 96.7% |
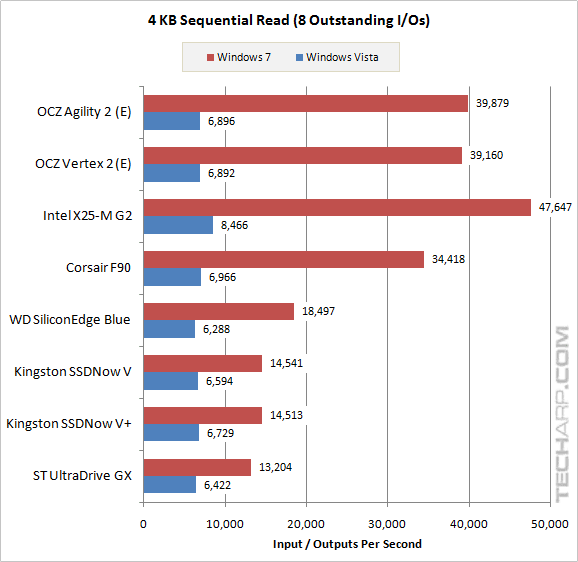
8 Outstanding I/Os
Solid State Drive |
Windows 7 |
Windows Vista |
Difference |
OCZ Agility 2 (E) |
39,879 IOPS |
6,896 IOPS |
+ 478.3% |
OCZ Vertex 2 (E) |
39,160 IOPS |
6,892 IOPS |
+ 468.2% |
Intel X25-M G2 (34 nm) |
47,647 IOPS |
8,466 IOPS |
+ 462.8% |
Corsair F90 |
34,418 IOPS |
6,966 IOPS |
+ 349.1% |
Western Digital SiliconEdge Blue |
18,497 IOPS |
6,288 IOPS |
+ 194.2% |
Kingston SSDNow V (Gen. 2) |
14,541 IOPS |
6,594 IOPS |
+ 120.5% |
Kingston SSDNow V+ (Gen. 2) |
14,513 IOPS |
6,729 IOPS |
+ 115.7% |
Super Talent UltraDrive GX |
13,204 IOPS |
6,42 IOPS |
+ 105.6% |
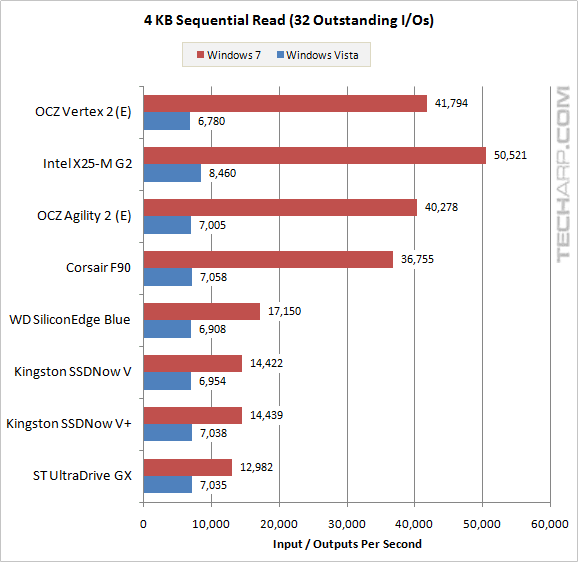
32 Outstanding I/Os
Solid State Drive |
Windows 7 |
Windows Vista |
Difference |
OCZ Vertex 2 (E) |
41,794 IOPS |
6,780 IOPS |
+ 516.4% |
Intel X25-M G2 (34 nm) |
50,521 IOPS |
8,460 IOPS |
+ 497.2% |
OCZ Agility 2 (E) |
40,278 IOPS |
7,005 IOPS |
+ 475.0% |
Corsair F90 |
36,755 IOPS |
7,058 IOPS |
+ 420.7% |
Western Digital SiliconEdge Blue |
17,150 IOPS |
6,908 IOPS |
+ 148.3% |
Kingston SSDNow V (Gen. 2) |
14,422 IOPS |
6,954 IOPS |
+ 107.4% |
Kingston SSDNow V+ (Gen. 2) |
14,439 IOPS |
7,038 IOPS |
+ 105.2% |
Super Talent UltraDrive GX |
12,982 IOPS |
7,035 IOPS |
+ 84.5% |
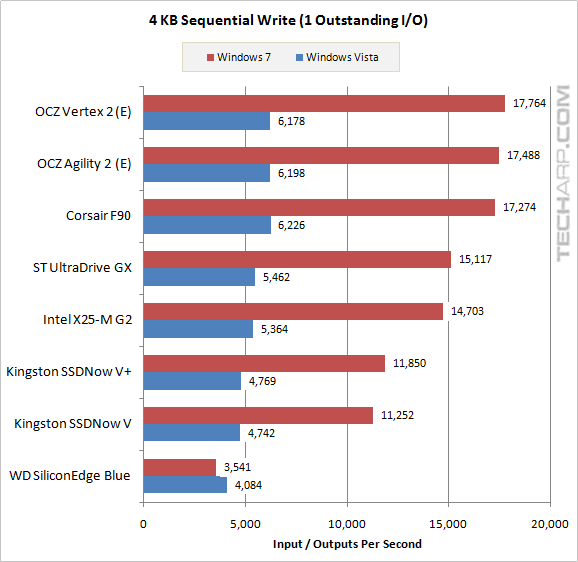
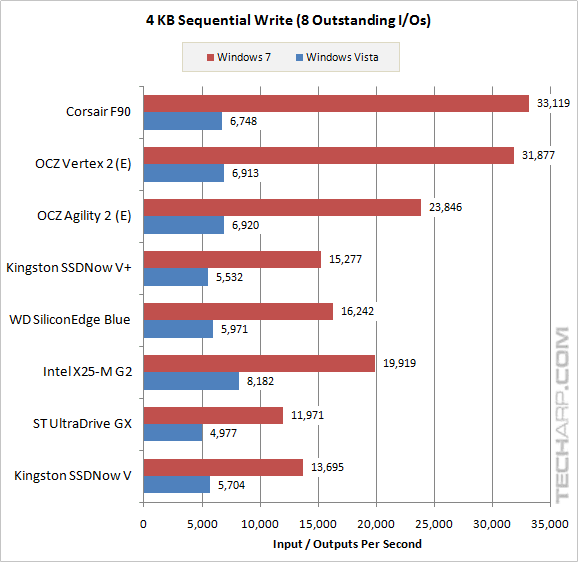
IOPS Scaling - 4 KB Sequential Write
1 Outstanding I/O
Solid State Drive |
Windows 7 |
Windows Vista |
Difference |
OCZ Vertex 2 (E) |
17,764 IOPS |
6,178 IOPS |
+ 187.6% |
OCZ Agility 2 (E) |
17,488 IOPS |
6,198 IOPS |
+ 182.2% |
Corsair F90 |
17,274 IOPS |
6,226 IOPS |
+ 177.4% |
Super Talent UltraDrive GX |
15,117 IOPS |
5,462 IOPS |
+ 176.8% |
Intel X25-M G2 (34 nm) |
14,703 IOPS |
5,364 IOPS |
+ 174.1% |
Kingston SSDNow V+ (Gen. 2) |
11,850 IOPS |
4,769 IOPS |
+ 148.5% |
Kingston SSDNow V (Gen. 2) |
11,252 IOPS |
4,742 IOPS |
+ 137.3% |
Western Digital SiliconEdge Blue |
3,541 IOPS |
4,084 IOPS |
- 13.3% |
8 Outstanding I/Os
Solid State Drive |
Windows 7 |
Windows Vista |
Difference |
Corsair F90 |
33,119 IOPS |
6,748 IOPS |
+ 390.8% |
OCZ Vertex 2 (E) |
31,669 IOPS |
6,918 IOPS |
+ 361.1% |
Kingston SSDNow V (Gen. 2) |
13,530 IOPS |
5,455 IOPS |
+ 140.1% |
Intel X25-M G2 (34 nm) |
19,397 IOPS |
8,407 IOPS |
+ 143.5% |
Kingston SSDNow V+ (Gen. 2) |
15,004 IOPS |
7,076 IOPS |
+ 176.1% |
Super Talent UltraDrive GX |
7,533 IOPS |
4,363 IOPS |
+ 140.6% |
OCZ Agility 2 (E) |
10,444 IOPS |
6,964 IOPS |
+ 244.6% |
Western Digital SiliconEdge Blue |
4,151 IOPS |
6,262 IOPS |
+ 172.0% |
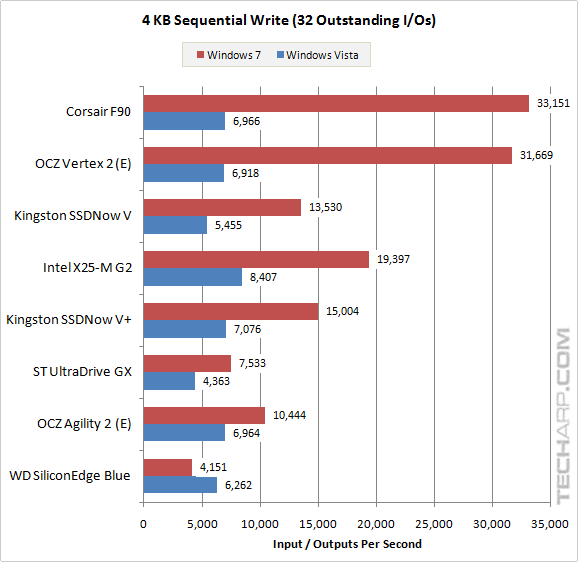
32 Outstanding I/Os
Solid State Drive |
Windows 7 |
Windows Vista |
Difference |
Corsair F90 |
33,151 IOPS |
6,966 IOPS |
+ 375.9% |
OCZ Vertex 2 (E) |
31,669 IOPS |
6,918 IOPS |
+ 357.7% |
Kingston SSDNow V (Gen. 2) |
13,530 IOPS |
5,455 IOPS |
+ 148.0% |
Intel X25-M G2 (34 nm) |
19,397 IOPS |
8,407 IOPS |
+ 130.7% |
Kingston SSDNow V+ (Gen. 2) |
15,004 IOPS |
7,076 IOPS |
+ 112.0% |
Super Talent UltraDrive GX |
7,533 IOPS |
4,363 IOPS |
+ 72.6% |
OCZ Agility 2 (E) |
10,444 IOPS |
6,694 IOPS |
+ 50.0% |
Western Digital SiliconEdge Blue |
4,151 IOPS |
6,262 IOPS |
- 33.7% |
Support Tech ARP!
If you like our work, you can help support out work by visiting our sponsors, participate in the Tech ARP Forums, or even donate to our fund. Any help you can render is greatly appreciated!
Introduction |
||
| Transfer Rate & Access Time |
||
| IOPS Scaling | ||
Conclusion |
<<< 512 KB Random Read + Write IOPS Scaling : Previous Page | Next Page : 512 KB Sequential Read + Write IOPS Scaling >>>