


 Add to Reddit

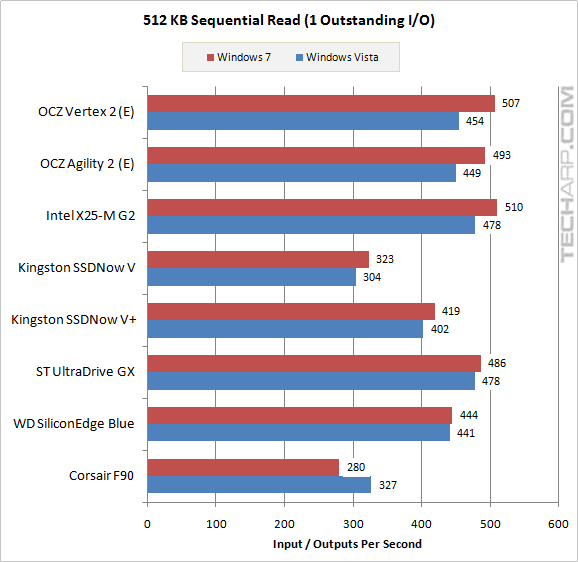
IOPS Scaling - 512 KB Sequential Read
1 Outstanding I/O
Solid State Drive |
Windows 7 |
Windows Vista |
Difference |
OCZ Vertex 2 (E) |
507 IOPS |
454 IOPS |
+ 11.6% |
OCZ Agility 2 (E) |
493 IOPS |
449 IOPS |
+ 9.7% |
Intel X25-M G2 (34 nm) |
510 IOPS |
478 IOPS |
+ 6.8% |
Kingston SSDNow V (Gen. 2) |
323 IOPS |
304 IOPS |
+ 6.2% |
Kingston SSDNow V+ (Gen. 2) |
419 IOPS |
402 IOPS |
+ 4.1% |
Super Talent UltraDrive GX |
486 IOPS |
478 IOPS |
+ 1.8% |
Western Digital SiliconEdge Blue |
444 IOPS |
441 IOPS |
+ 0.7% |
Corsair F90 |
280 IOPS |
327 IOPS |
- 14.3% |
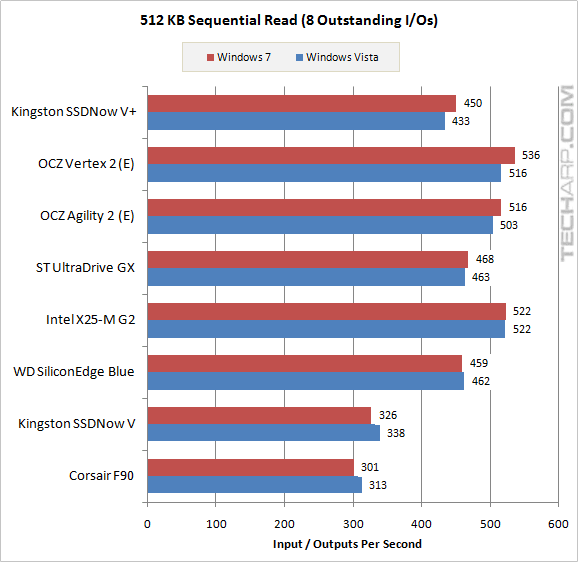
8 Outstanding I/Os
Solid State Drive |
Windows 7 |
Windows Vista |
Difference |
Kingston SSDNow V+ (Gen. 2) |
450 IOPS |
433 IOPS |
+ 3.9% |
OCZ Vertex 2 (E) |
536 IOPS |
516 IOPS |
+ 3.8% |
OCZ Agility 2 (E) |
516 IOPS |
503 IOPS |
+ 2.6% |
Super Talent UltraDrive GX |
468 IOPS |
463 IOPS |
+ 1.1% |
Intel X25-M G2 (34 nm) |
522 IOPS |
522 IOPS |
+ 0.1% |
Western Digital SiliconEdge Blue |
459 IOPS |
462 IOPS |
- 0.6% |
Kingston SSDNow V (Gen. 2) |
326 IOPS |
338 IOPS |
- 3.6% |
Corsair F90 |
301 IOPS |
313 IOPS |
- 3.8% |
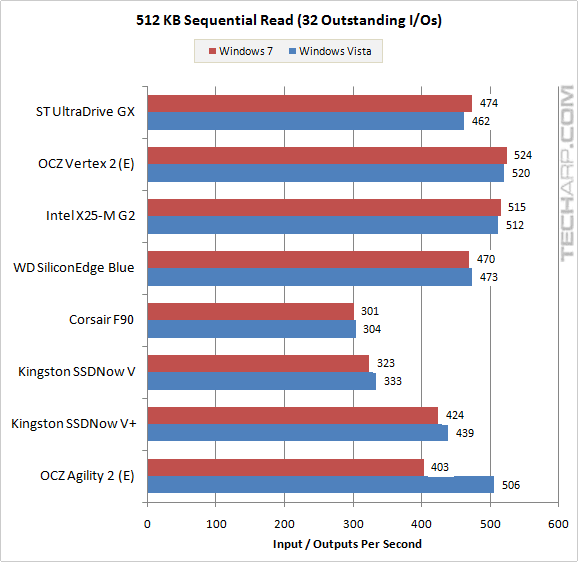
32 Outstanding I/Os
Solid State Drive |
Windows 7 |
Windows Vista |
Difference |
Super Talent UltraDrive GX |
474 IOPS |
462 IOPS |
+ 2.6% |
OCZ Vertex 2 (E) |
524 IOPS |
520 IOPS |
+ 0.8% |
Intel X25-M G2 (34 nm) |
515 IOPS |
512 IOPS |
+ 0.7% |
Western Digital SiliconEdge Blue |
470 IOPS |
473 IOPS |
- 0.8% |
Corsair F90 |
301 IOPS |
304 IOPS |
- 1.1% |
Kingston SSDNow V (Gen. 2) |
323 IOPS |
333 IOPS |
- 3.0% |
Kingston SSDNow V+ (Gen. 2) |
424 IOPS |
439 IOPS |
- 3.4% |
OCZ Agility 2 (E) |
403 IOPS |
506 IOPS |
- 20.3% |
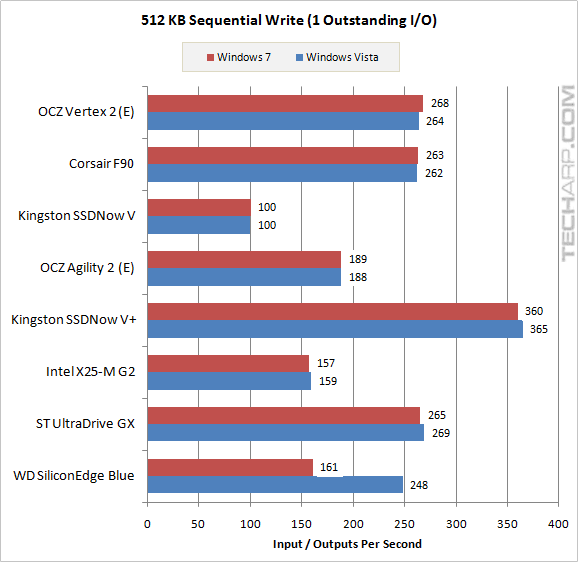
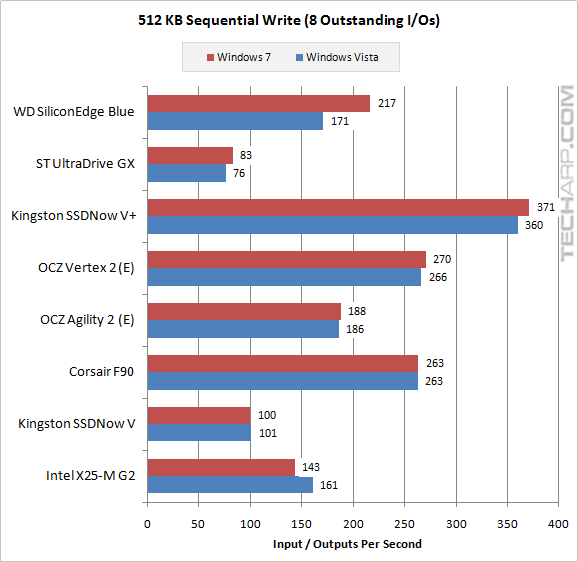
IOPS Scaling - 512 KB Sequential Write
1 Outstanding I/O
Solid State Drive |
Windows 7 |
Windows Vista |
Difference |
OCZ Vertex 2 (E) |
268 IOPS |
264 IOPS |
+ 1.6% |
Corsair F90 |
263 IOPS |
262 IOPS |
+ 0.4% |
Kingston SSDNow V (Gen. 2) |
100 IOPS |
100 IOPS |
+ 0.4% |
OCZ Agility 2 (E) |
189 IOPS |
188 IOPS |
+ 0.1% |
Kingston SSDNow V+ (Gen. 2) |
360 IOPS |
365 IOPS |
- 1.3% |
Intel X25-M G2 (34 nm) |
157 IOPS |
159 IOPS |
- 1.3% |
Super Talent UltraDrive GX |
265 IOPS |
269 IOPS |
- 1.4% |
Western Digital SiliconEdge Blue |
161 IOPS |
248 IOPS |
- 35.2% |
8 Outstanding I/Os
Solid State Drive |
Windows 7 |
Windows Vista |
Difference |
Western Digital SiliconEdge Blue |
219 IOPS |
21 IOPS |
+ 26.7% |
Super Talent UltraDrive GX |
242 IOPS |
257 IOPS |
+ 9.0% |
Kingston SSDNow V+ (Gen. 2) |
72 IOPS |
236 IOPS |
+ 3.1% |
OCZ Vertex 2 (E) |
25 IOPS |
25 IOPS |
+ 1.5% |
OCZ Agility 2 (E) |
175 IOPS |
175 IOPS |
+ 1.1% |
Corsair F90 |
263 IOPS |
263 IOPS |
+ 0.1% |
Kingston SSDNow V (Gen. 2) |
14 IOPS |
17 IOPS |
- 1.0% |
Intel X25-M G2 (34 nm) |
57 IOPS |
13 IOPS |
- 10.7% |
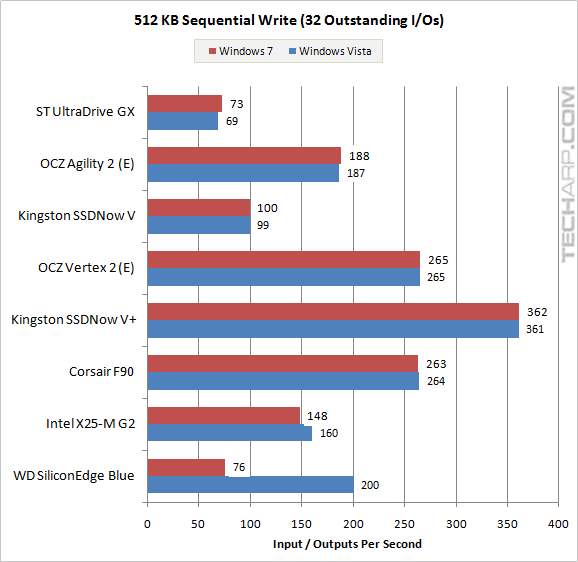
32 Outstanding I/Os
Solid State Drive |
Windows 7 |
Windows Vista |
Difference |
Super Talent UltraDrive GX |
73 IOPS |
69 IOPS |
+ 5.8% |
OCZ Agility 2 (E) |
188 IOPS |
187 IOPS |
+ 0.9% |
Kingston SSDNow V (Gen. 2) |
100 IOPS |
99 IOPS |
+ 0.3% |
OCZ Vertex 2 (E) |
265 IOPS |
265 IOPS |
+ 0.1% |
Kingston SSDNow V+ (Gen. 2) |
362 IOPS |
361 IOPS |
+ 0.1% |
Corsair F90 |
263 IOPS |
264 IOPS |
- 0.3% |
Intel X25-M G2 (34 nm) |
148 IOPS |
160 IOPS |
- 7.7% |
Western Digital SiliconEdge Blue |
76 IOPS |
200 IOPS |
- 62.1% |
Support Tech ARP!
If you like our work, you can help support out work by visiting our sponsors, participate in the Tech ARP Forums, or even donate to our fund. Any help you can render is greatly appreciated!
Introduction |
||
| Transfer Rate & Access Time |
||
| IOPS Scaling | ||
Conclusion |
<<< 4 KB Sequential Read + Write IOPS Scaling : Previous Page | Next Page : Conclusion (With Summary Of Results) >>>