


 Add to Reddit

IO Meter
We compared the 240 GB HyperX Savage SSD to the industry standard - the Intel 520 Series SSD. If you wish to see how the HyperX Savage compares to other solid state drives, take a look at our Solid State Drive Performance Comparison Guide, which we will be updating shortly.
| If you like this article, please share it! -> |
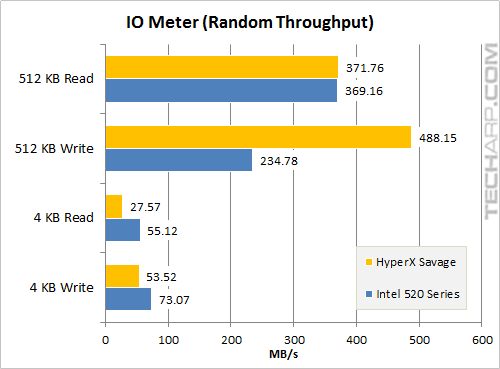
Throughput (Random Access)
Test |
HyperX Savage |
Intel 520 Series |
Difference |
512 KB Read |
371.76 MB/s |
369.16 MB/s |
+ 0.7% |
512 KB Write |
488.15 MB/s |
234.78 MB/s |
+ 107.9% |
4 KB Read |
27.57 MB/s |
55.12 MB/s |
- 50.0% |
4 KB Write |
53.52 MB/s |
73.07 MB/s |
- 26.8% |
The small random reads and writes are the most important tests for applications that make a lot of random accesses, so those would be key performance indicators for SSDs.
The 240 GB HyperX Savage appears to be tuned for large writes. It was only half as fast as the 240 GB Intel 520 in small reads, and 27% slower in small writes; but when it came to large writes, it was more than twice as fast as the 240 GB Intel 520!
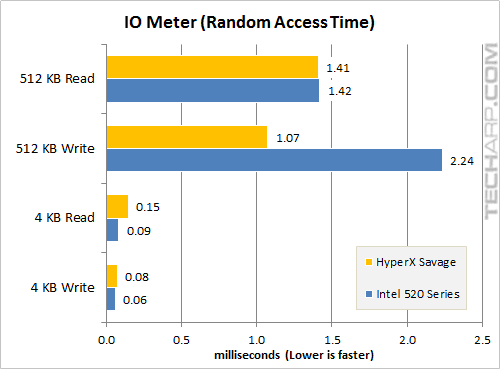
Random Access Time
Test |
HyperX Savage |
Intel 520 Series |
Difference |
512 KB Read |
1.41 ms |
1.42 ms |
- 0.7% |
512 KB Write |
1.07 ms |
2.24 ms |
- 51.9% |
4 KB Read |
0.15 ms |
0.09 ms |
+ 74.3% |
4 KB Write |
0.08 ms |
0.06 ms |
+ 26.6% |
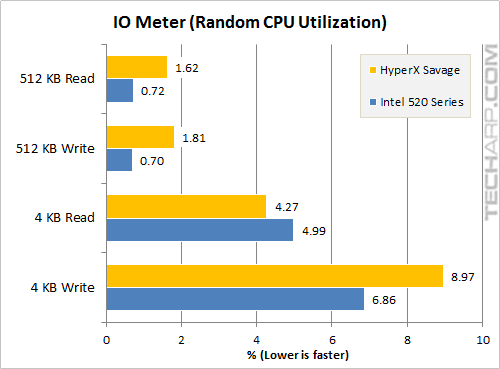
CPU Utilization (Random Access)
Test |
HyperX Savage |
Intel 520 Series |
Difference |
512 KB Read |
1.62% |
0.72% |
+ 126.6% |
512 KB Write |
1.81% |
0.70% |
+ 160.4% |
4 KB Read |
4.27% |
4.99% |
- 14.5% |
4 KB Write |
8.97% |
6.86% |
+ 30.7% |
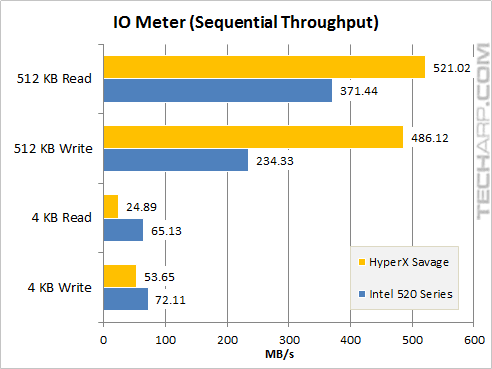
Throughput (Sequential Access)
Test |
HyperX Savage |
Intel 520 Series |
Difference |
512 KB Read |
521.02 MB/s |
371.44 MB/s |
+ 40.3% |
512 KB Write |
486.12 MB/s |
234.33 MB/s |
+ 107.5% |
4 KB Read |
24.89 MB/s |
65.13 MB/s |
- 61.8% |
4 KB Write |
53.65 MB/s |
72.11 MB/s |
- 25.6% |
The large sequential read and write performance indicators determine how fast you can copy or move files. Its large read performance also determines how fast you can launch an application or game.
In this test, it is obvious that the 240 GB HyperX Savage is optimized for large sequential reads and writes. It had an impressive lead in large read performacne over the 240 GB Intel 520 but its large sequential write performance, in particular, was phenomenal - registering more than twice the write speed of the 240 GB Intel 520!
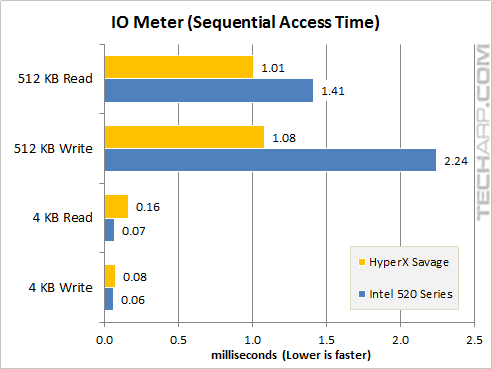
Sequential Access Time
Test |
HyperX Savage |
Intel 520 Series |
Difference |
512 KB Read |
1.01 ms |
1.41 ms |
- 28.7% |
512 KB Write |
1.08 ms |
2.24 ms |
- 51.9% |
4 KB Read |
0.16 ms |
0.07 ms |
+ 152.4% |
4 KB Write |
0.08 ms |
0.06 ms |
+ 26.4% |
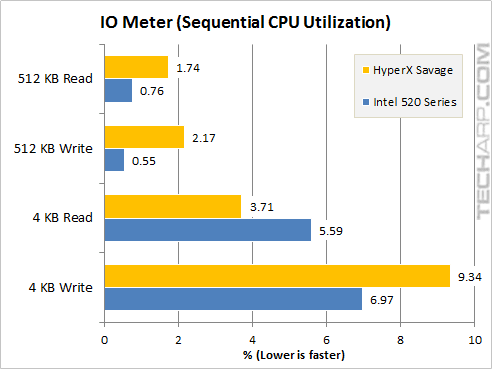
CPU Utilization (Sequential Access)
Test |
HyperX Savage |
Intel 520 Series |
Difference |
512 KB Read |
1.74% |
0.76% |
+ 128.3% |
512 KB Write |
2.17% |
0.55% |
+ 298.2% |
4 KB Read |
3.71% |
5.59% |
- 33.6% |
4 KB Write |
9.34% |
6.97% |
+ 34.0% |
Support Tech ARP!
If you like our work, you can help support out work by visiting our sponsors, participate in the Tech ARP Forums, or even donate to our fund. Any help you can render is greatly appreciated!
Page |
240 GB HyperX Savage SSD Review |
|
1 |
||
2 |
• The 240 GB HyperX Savage SSD |
|
3 |
• USB 3.0 Enclosure, Bracket & Spacer |
|
4 |
• Testing The 240 GB HyperX Savage |
|
5 |
||
6 |
||
7 |
||
8 |
||
9 |
||
10 |
||
11 |
Support us by buying from Amazon.com! |
|
| Grab a FREE 30-day trial of Amazon Prime for free shipping, instant access to 40,000 movies and TV episodes and the Kindle Owners' Lending Library! | |
<<< Transfer Rate Range & Profile, WinBench 99 Test Results : Previous Page | Next Page : IOPS Scaling (Random Access) >>>