Surface Temperature
We monitored the surface temperature of five solid state drives, together with a low-powered hard disk drive for comparison, during their benchmark runs. The following chart shows their operating temperature range, from idle to maximum load. Please note that instead of giving you the absolute numbers, we are showing the temperature delta, which is the difference between the actual temperature and the ambient room temperature.
The Kingston SSDNow V+ 64 GB SSD was the second-coolest drive in this comparison, running just a tad warmer than the 30 GB Kingston SSDNow V (Gen 2). It didn't matter whether it was idling or running at full load - it was much cooler than the other drives we tested. In fact, at full load, it was just a little (0.4 °C) hotter than the 2 TB Western Digital Caviar Green was at idle.
Of course, this excellent performance is partly due to the lower number of NAND flash chips used in this 64 GB model. Hence, the even lower temperature seen with the 30 GB Kingston SSDNow V. You can expect the power consumption (and temperature) to go up in SSDNow V+ models with larger strorage capacities.
WinBench 99 Version 2.0
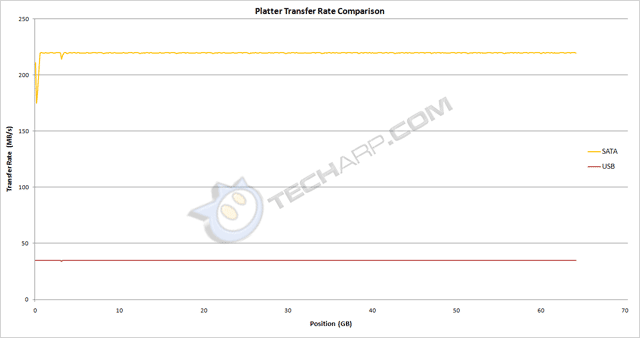
Transfer Rate Profile
Unlike hard disk drives, solid state drives do not have different areal densities. Hence, an almost completely flat transfer rate profile across the entire capacity. The Kingston SSDNow V+ SSD delivered a read throughput of around 220 MB/s, which is about 4% below the maximum read speed of 230 MB/s.
When used with the USB enclosure, its ultra-high throughput was capped by the speed of the USB interface. It only managed to deliver a throughput of about 35 MB/s.
Support Tech ARP!
If you like our work, you can help support out work by visiting our sponsors, participate in the Tech ARP Forums, or even donate to our fund. Any help you can render is greatly appreciated!
Page |
Topic |
|
1 |
• Overview |
|
2 |
||
3 |
• The Kingston SSDNow V+ 64 GB SSD |
|
4 |
||
5 |
||
6 |
||
7 |
||
8 |
||
9 |
||
10 |
||
11 |
||
12 |
||
13 |
||


 Add to Reddit

