


 Add to Reddit

IOPS Scaling
In these tests, we examined the drive's ability to tackle multiple operations simultaneously. Again, we compared the Kingston SSDNow V+ to the 128 GB Super Talent UltraDrive GX. If you wish to see how the Kingston SSDNow V+ compares to other solid state drives, please take a look at our Solid State Drive Performance Comparison Guide.
4 KB Random Read
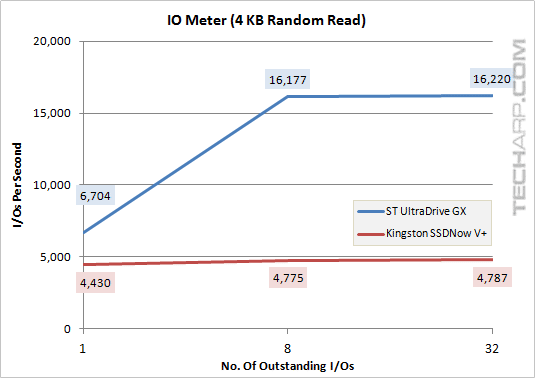
Outstanding I/Os |
Kingston SSDNow V+ |
ST UltraDrive GX |
Difference |
1 |
4,430 IOPS |
6,704 IOPS |
- 33.9% |
8 |
4,775 IOPS |
16,177 IOPS |
- 70.5% |
32 |
4,787 IOPS |
16,220 IOPS |
- 70.5% |
4 KB Random Write
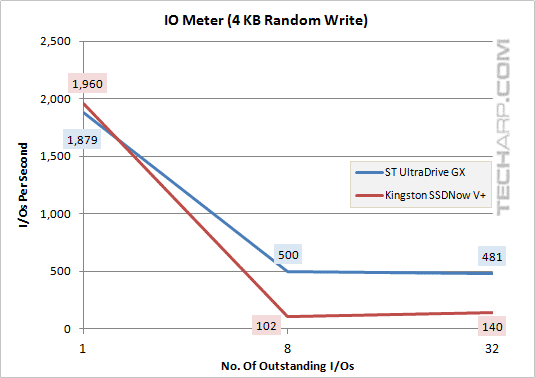
Outstanding I/Os |
Kingston SSDNow V+ |
ST UltraDrive GX |
Difference |
1 |
1,960 IOPS |
1,879 IOPS |
+ 4.3% |
8 |
102 IOPS |
500 IOPS |
- 79.6% |
32 |
140 IOPS |
481 IOPS |
- 71.0% |
512 KB Random Read
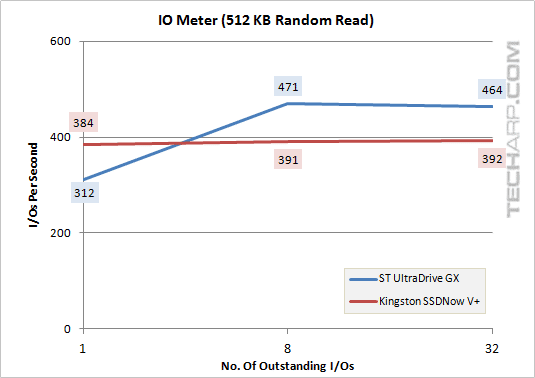
Outstanding I/Os |
Kingston SSDNow V+ |
ST UltraDrive GX |
Difference |
1 |
384 IOPS |
312 IOPS |
+ 23.2% |
8 |
391 IOPS |
471 IOPS |
- 17.0% |
32 |
392 IOPS |
464 IOPS |
- 15.4% |
512 KB Random Write
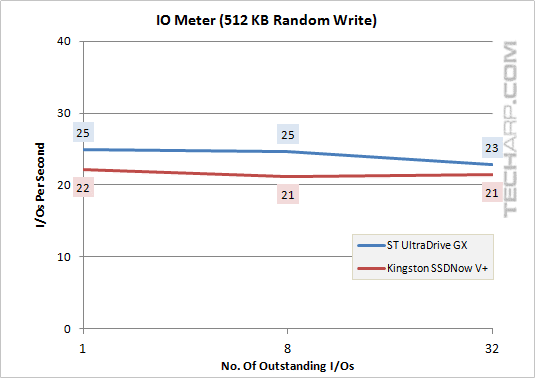
Outstanding I/Os |
Kingston SSDNow V+ |
ST UltraDrive GX |
Difference |
1 |
22 IOPS |
25 IOPS |
- 10.9% |
8 |
21 IOPS |
25 IOPS |
- 14.3% |
32 |
21 IOPS |
23 IOPS |
-5.8% |
Support Tech ARP!
If you like our work, you can help support out work by visiting our sponsors, participate in the Tech ARP Forums, or even donate to our fund. Any help you can render is greatly appreciated!
Page |
Topic |
|
1 |
• Overview |
|
2 |
||
3 |
• The Kingston SSDNow V+ 64 GB SSD |
|
4 |
||
5 |
||
6 |
||
7 |
||
8 |
||
9 |
||
10 |
||
11 |
||
12 |
||
13 |
||
<<< IO Meter Sequential Access Results : Previous Page | Next Page : IOPS Scaling (Sequential Access) >>>