


 Add to Reddit

IOPS Scaling
In these tests, we tested the drive's ability to tackle multiple input/output operations. Again, we compared the Western Digital SiliconEdge Blue to the Intel X25-M G2 (34 nm). If you wish to see how the WD SiliconEdge Blue compares to other solid state drives, please take a look at our Solid State Drive Performance Comparison Guide.
4 KB Sequential Read
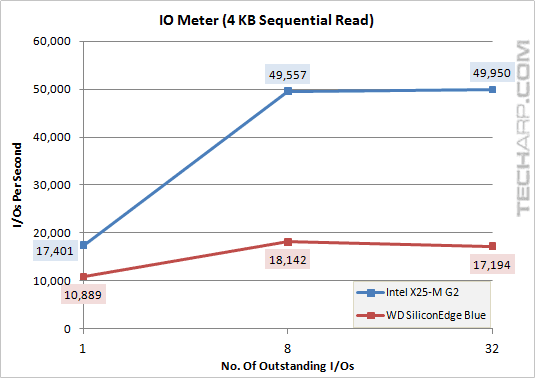
Outstanding I/Os |
WD SiliconEdge Blue |
Intel X25-M G2 |
Difference |
1 |
10,889 IOPS |
17,401 IOPS |
- 37.4% |
8 |
18,142 IOPS |
49,557 IOPS |
- 63.4% |
32 |
17,194 IOPS |
49,950 IOPS |
- 65.6% |
4 KB Sequential Write
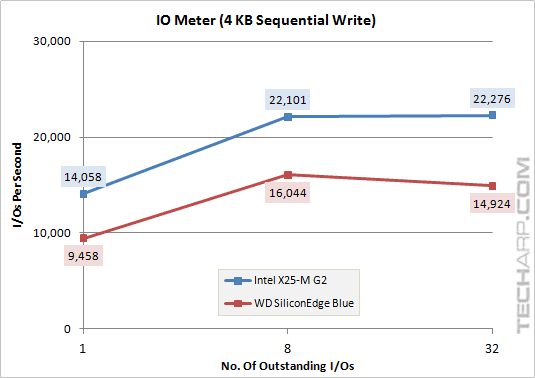
Outstanding I/Os |
WD SiliconEdge Blue |
Intel X25-M G2 |
Difference |
1 |
9,458 IOPS |
14,058 IOPS |
- 32.7% |
8 |
16,044 IOPS |
22,101 IOPS |
- 27.4% |
32 |
14,924 IOPS |
22,276 IOPS |
- 33.0% |
512 KB Sequential Read
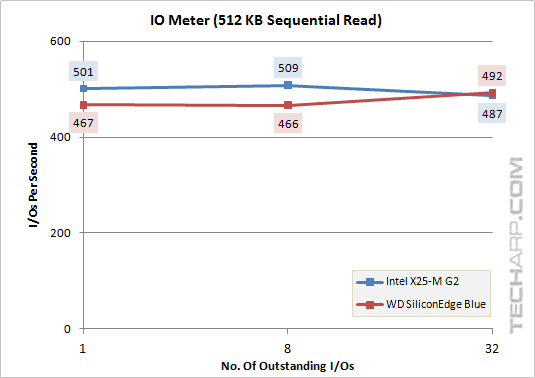
Outstanding I/Os |
WD SiliconEdge Blue |
Intel X25-M G2 |
Difference |
1 |
467 IOPS |
501 IOPS |
- 6.9% |
8 |
466 IOPS |
509 IOPS |
- 8.3% |
32 |
492 IOPS |
487 IOPS |
+ 1.0% |
512 KB Sequential Write
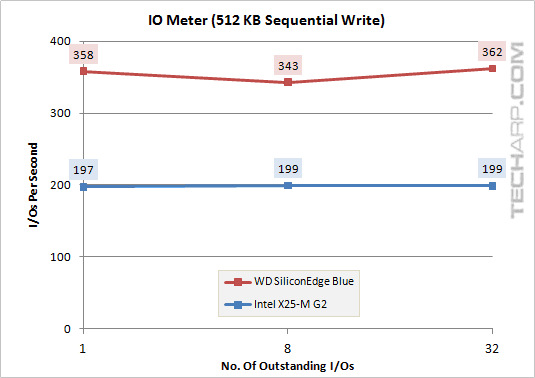
Outstanding I/Os |
WD SiliconEdge Blue |
Intel X25-M G2 |
Difference |
1 |
358 IOPS |
197 IOPS |
+ 81.6% |
8 |
343 IOPS |
199 IOPS |
+ 72.1% |
32 |
362 IOPS |
199 IOPS |
+ 82.1% |
Support Tech ARP!
If you like our work, you can help support out work by visiting our sponsors, participate in the Tech ARP Forums, or even donate to our fund. Any help you can render is greatly appreciated!
Page |
Topic |
|
1 |
• Overview |
|
2 |
||
3 |
• The WD SiliconEdge Blue 256 GB SSD |
|
4 |
||
5 |
||
6 |
||
7 |
||
8 |
||
9 |
||
10 |
||
11 |
||
12 |
||