


 Add to Reddit

Random Access Performance
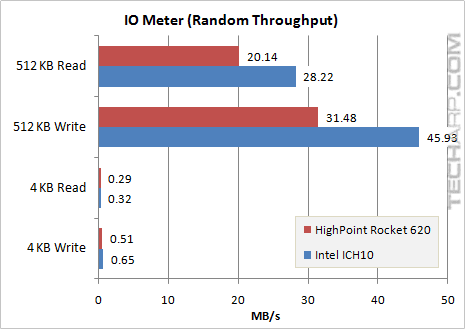
Throughput
Test |
Intel ICH10 |
HighPoint |
Difference |
512 KB Read |
28.22 MB/s |
20.14 MB/s |
- 28.6% |
512 KB Write |
45.93 MB/s |
31.48 MB/s |
- 31.5% |
4 KB Read |
0.32 MB/s |
0.29 MB/s |
- 9.4% |
4 KB Write |
0.65 MB/s |
0.51 MB/s |
- 21.5% |
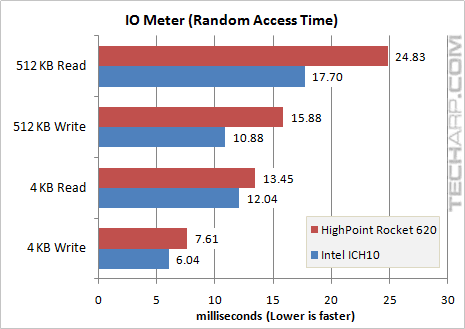
Access Time
Test |
Intel ICH10 |
HighPoint |
Difference |
512 KB Read |
17.70 ms |
24.83 ms |
+ 40.3% |
512 KB Write |
10.88 ms |
15.88 ms |
+ 46.0% |
4 KB Read |
12.04 ms |
13.45 ms |
+ 11.7% |
4 KB Write |
6.04 ms |
7.61 ms |
+ 26.0% |
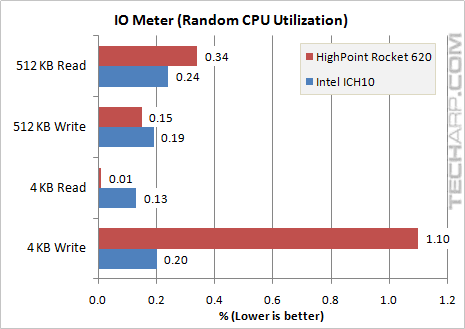
CPU Utilization
Test |
Intel ICH10 |
HighPoint |
Difference |
512 KB Read |
0.24% |
0.34% |
+ 41.7% |
512 KB Write |
0.19% |
0.15% |
- 21.1% |
4 KB Read |
0.13% |
0.01% |
- 92.3% |
4 KB Write |
0.20% |
1.10% |
+ 450.0% |
Support Tech ARP!
If you like our work, you can help support out work by visiting our sponsors, participate in the Tech ARP Forums, or even donate to our fund. Any help you can render is greatly appreciated!
Page |
Topic |
|
1 |
||
2 |
• Disk WinBench 99 Test Results |
|
3 |
||
4 |
||
5 |
||
6 |
||
7 |
||
<<< Disk WinBench 99 Results, Disk Transfer Rate Range, Platter Profile Comparison : Previous Page | Next Page : Sequential Access Performance >>>