


 Add to Reddit

Testing The Seagate Laptop SSHD
The Testbed
Processors |
|
Motherboard |
|
Memory |
Two Kingmax 2 GB DDR3-1333 modules |
Graphics Card |
|
Hard Drives |
1 TB Seagate Laptop SSHD (ST1000UM000) |
Operating System |
Microsoft Windows 7 64-bit |
Testing Methodology
Testing Methodology
We tested in both Windows 7 and Windows Vista, with the latest updates. We chose to use IO Meter 1.1.0 RC1 as well as our "old faithful", WinBench 99 2.0, with the following tests :
- Platter Data Transfer Profile
- Business Disk WinMark 99
- High-End Disk WinMark 99
- Disk Transfer Rate (Beginning)
- Disk Transfer Rate (End)
Business Disk WinMark 99 is a real-world simulation based on three office application suites - Microsoft Office 97, Lotus SmartSuite and Corel WordPerfect Suite 8, as well as a web browser, Netscape Navigator. They are quite dated, but should still reflect the usage patterns of users in an office environment using such applications. The test runs through a script that keeps multiple applications open, while it performs tasks that switches between those applications and Netscape Navigator. The result is the average transfer rate during the script run.
High-End Disk WinMark 99 is a real-world simulation based on AVS/Express 3.4, FrontPage 98, MicroStation SE, Photoshop 4.0, Premiere 4.2, Sound Forge 4.0 and Visual C++ 5.0. However, it differs by running the applications serially, instead of simultaneously. There are individual results for each application but in this comparison, we will be looking only at the weighted average score, which is the average transfer rate during the tests.
Unfortunately, WinBench 99 seemed to have some issues with Windows Vista, or the current Vista driver for the SATA controller. It would register a SetFilePointer error in the Disk Access Time test. So, we were not able to obtain any Disk Access Time results.
Usable Capacity
) |
This 1 TB Seagate Laptop SSHD drive officially has a formatted capacity of 1,000,204,886,016 bytes. We checked that out by formatting both in NTFS using Microsoft Windows 7.
The actual formatted capacity was 1,000,068,870,144 bytes. This is 136 MB lower than the official formatted capacity. With just over 124 MB allocated to the NTFS file system, the actual usable capacity remained slightly under 1,000 GB.
The integrated solid state drive isn't visible, because it serves as a cache. However, it is likely that a portion of it will be reserved for garbage collection purposes.
Maximum Surface Temperature
We monitored the surface temperature of six hard disk drives during their benchmarks. The following chart shows their operating temperature range, from idle to maximum load. Please note that instead of giving you the absolute numbers, we are showing the temperature delta, which is the difference between the actual temperature and the ambient room temperature.
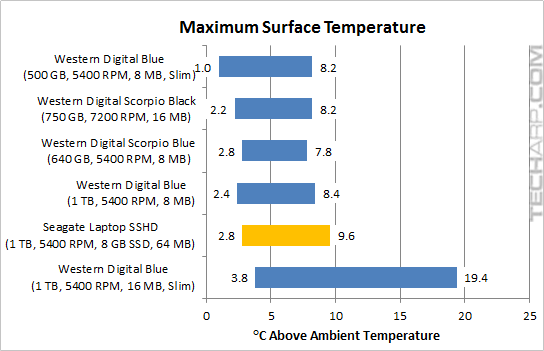
The 1 TB Seagate Laptop SSHD runs a little warmer than the typical 5400 RPM mobile hard disk drive, but it was nothing compared to the 1 TB WD Blue (WD10SPCX), which ran significantly hotter than the other drives in the comparison.
However, please note that the highest surface temperature of the 1 TB WD Blue (WD10SPCX) was taken from the PCB, not the drive itself. Still, its idle temperature was much higher than that of the other drives.
Disk Transfer Rate
This chart shows you the range of platter-to-buffer transfer rates from the innermost track to the outermost track. In other words, it shows you the range of disk transfer rates of the hard disk drives (from minimum and maximum).
![]()
The disk transfer rate range of the 1 TB Seagate Laptop SSHD is oddly narrow. This is likely due to the effect the solid state cache. Unfortunately, due to te integrated design, it is impossible to isolate the performance characteristics of the HDD proper.
Even though the 1 TB Seagate Laptop SSHD uses 500 GB platters, like the 1 TB WD Blue Slim (WD10SPCX), the 1 TB WD Blue (WD10JPVT) and the 500 GB WD Blue Slim (WD5000LPVT), it's interesting to note that its peak transfer rate was significantly lower than those pure hard disk drives.
Platter Data Transfer Profile
We compared the platter profile of the 1 TB Seagate Laptop SSHD to those of the 1 TB WD Blue Slim (WD10SPCX) and the 500 GB WD Blue Slim (WD5000LPVT). With the exception of the WD6400BEVT which uses lower-density 320 GB platters, the other drives sport high-density 500 GB platters.
)
The maximum platter transfer rate appeared to be about 110 MB/s which progressively dropped across the platter to about 60 MB/s at the last track. The platter quality seems to be pretty good in this sample, with no significantly visible dips which would suggest the use of replacement sectors.
There was a massive jump at the end, but it's not because the solid state cache was somehow attached to the end of the HDD. We know this for sure because the part is at least 28 GB wide. This is why we would attribute the jump to the Adaptive Memory Technology shifting the reads to the solid state cache, because it was a solid line thereafter.
The 1 TB Seagate Laptop SSHD has a very similar platter profile to the 1 TB WD Blue Slim. The only difference is it started out with a lower transfer rate but maintained it for a much longer time, eventually becoming faster than the 1 TB WD Blue Slim from the 400 GB point onwards.
| If you like this article, please share it! -> |
Support Tech ARP!
If you like our work, you can help support out work by visiting our sponsors, participate in the Tech ARP Forums, or even donate to our fund. Any help you can render is greatly appreciated!
Support us by buying from Amazon.com! |
|
| Grab a FREE 30-day trial of Amazon Prime for free shipping, instant access to 40,000 movies and TV episodes and the Kindle Owners' Lending Library! | |
<<< The Seagate Laptop SSHD, Advanced Format, Adaptive Memory & More : Previous Page | Next Page : WinBench 99 Results >>>