


 Add to Reddit

IO Meter
We compared the OCZ Vertex 2 to the OCZ Agility 2 (E). If you wish to see how the OCZ Vertex 2 compares to other solid state drives, take a look at our Solid State Drive Performance Comparison Guide.
Do note that these results are based on the average of separate tests using compressible and non-compressible data. This is to address the fact the newer SSD controllers like the SandForce SF-1222 compress data for better performance and lower wear on the memory cells.
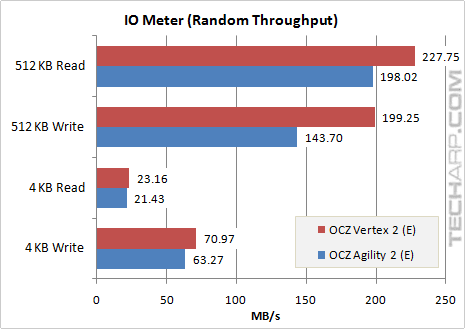
Throughput (Random Access)
Test |
OCZ Vertex 2 (E) |
OCZ Agility 2 (E) |
Difference |
512 KB Read |
227.75 MB/s |
198.02 MB/s |
+ 15.0% |
512 KB Write |
199.25 MB/s |
143.70 MB/s |
+ 38.7% |
4 KB Read |
23.16 MB/s |
21.43 MB/s |
+ 8.0% |
4 KB Write |
70.97 MB/s |
63.27 MB/s |
+ 12.2% |
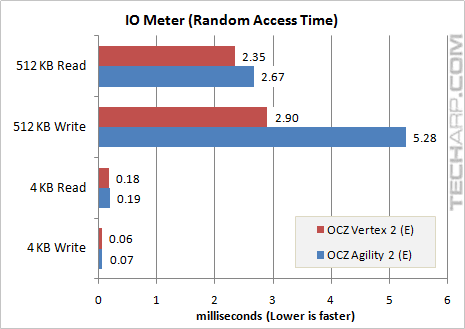
Random Access Time
Test |
OCZ Vertex 2 (E) |
OCZ Agility 2 (E) |
Difference |
512 KB Read |
2.35 ms |
2.67 ms |
- 12.0% |
512 KB Write |
2.90 ms |
5.28 ms |
- 45.0% |
4 KB Read |
0.18 ms |
0.19 ms |
- 5.3% |
4 KB Write |
0.06 ms |
0.07 ms |
- 7.7% |
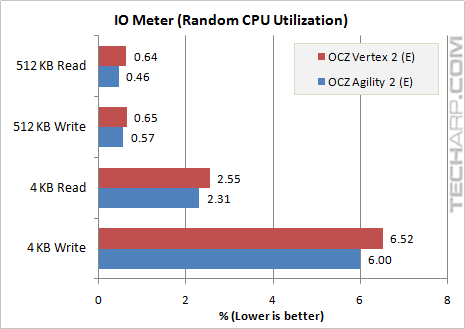
CPU Utilization (Random Access)
Test |
OCZ Vertex 2 (E) |
OCZ Agility 2 (E) |
Difference |
512 KB Read |
0.64% |
0.46% |
+ 38.0% |
512 KB Write |
0.65% |
0.57% |
+ 13.2% |
4 KB Read |
2.55% |
2.31% |
+ 10.2% |
4 KB Write |
6.52% |
6.00% |
+ 8.7% |
Support Tech ARP!
If you like our work, you can help support out work by visiting our sponsors, participate in the Tech ARP Forums, or even donate to our fund. Any help you can render is greatly appreciated!
Page |
Topic |
|
1 |
||
2 |
||
3 |
• The Vertex 2 (E) 120 GB SSD |
|
4 |
||
5 |
||
6 |
||
7 |
||
8 |
||
9 |
||
10 |
||
11 |
||
12 |
<<< WinBench 99 Test Results, Transfer Rate Range : Previous Page | Next Page : IO Meter Sequential Access Performance >>>