


 Add to Reddit

IO Meter
We compared the 3 TB Western Digital Red (WD30EFRX) to the 3 TB Western Digital Caviar Green (WD30EZRX), because it was the closest match and would have been used instead of the WD Red in a NAS system. For more performance comparisons, please take a look at The Hard Disk Drive Performance Comparison Guide.
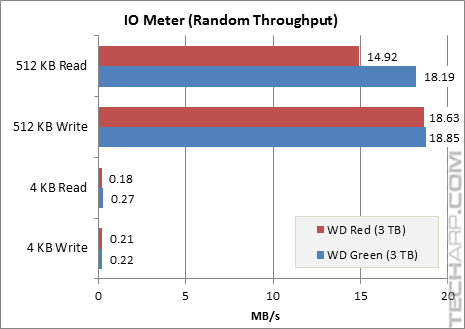
Throughput (Random Access)
Test |
WD Red (3 TB) |
WD Green (3 TB) |
Difference |
512 KB Read |
14.92 MB/s |
18.19 MB/s |
- 18.0% |
512 KB Write |
18.63 MB/s |
18.65 MB/s |
- 1.2% |
4 KB Read |
0.18 MB/s |
0.27 MB/s |
- 33.3% |
4 KB Write |
0.21 MB/s |
0.22 MB/s |
- 4.5% |
The small random reads and writes are the most important tests for applications that make a lot of random accesses, so those would be key performance indicators for drives that are used as boot or system drives, but not important for NAS systems.
Even though the WD Red is almost identical to the WD Green and is actually capable of a higher raw throughput, its random read performance was significantly poorer than the WD Green. Its small random read performance was especially bad. That said, this wouldn't make much of a difference in a NAS system, but it makes the WD Red a bad drive to use in a desktop or workstation.
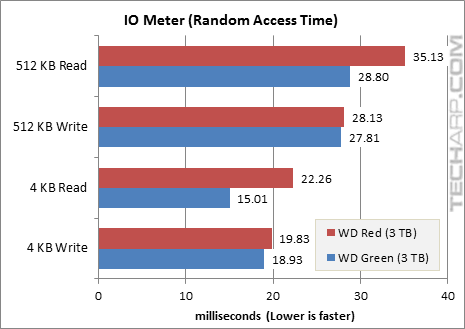
Random Access Time
Test |
WD Red (3 TB) |
WD Green (3 TB) |
Difference |
512 KB Read |
35.13 ms |
28.80 ms |
+ 22.0% |
512 KB Write |
28.13 ms |
27.81 ms |
+ 1.2% |
4 KB Read |
22.26 ms |
15.01 ms |
+ 48.3% |
4 KB Write |
19.83 ms |
18.93 ms |
+ 4.8% |
The WD Red's poor random read results above were confirmed by its random read access times. As you can see, the WD Red's random access time was almost 50% longer than the WD Green in small reads, and over 20% longer in large reads.
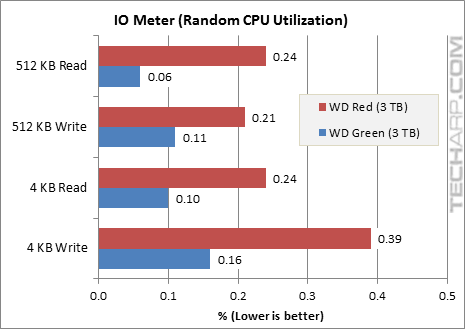
CPU Utilization (Random Access)
Test |
WD Red (3 TB) |
WD Green (3 TB) |
Difference |
512 KB Read |
0.24% |
0.06% |
+ 300.0% |
512 KB Write |
0.21% |
0.11% |
+ 90.9% |
4 KB Read |
0.24% |
0.10% |
+ 140.0% |
4 KB Write |
0.39% |
0.16% |
+ 143.8% |
Support Tech ARP!
If you like our work, you can help support out work by visiting our sponsors, participate in the Tech ARP Forums, or even donate to our fund. Any help you can render is greatly appreciated!
Page |
Topic |
|
1 |
||
2 |
||
3 |
• The 3 TB Western Digital Red |
|
4 |
• Peeking Under The PCB |
|
5 |
||
6 |
• Testing The 3 TB Western Digital Red |
|
7 |
||
8 |
||
9 |
||
10 |
||
11 |
||
12 |
||
13 |
<<< WinBench 99 Test Results : Previous Page | Next Page : IO Meter Sequential Access Performance >>>