


 Add to Reddit

WinBench 99 Version 2.0
Business Disk WinBench 99
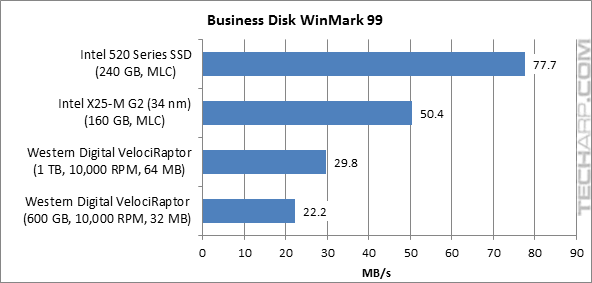
The two SSDs were much faster in this real-world test of business applications, with the Intel 520 Series SSD being 2.6X faster than the new 1 TB Western Digital VelociRaptor, and 3.5X faster than the 600 GB Western Digital VelociRaptor.
HDD / SSD Model |
Transfer |
Difference |
Useful Links |
||||
Intel 520 |
Intel X25-M |
1 TB WD |
600 GB WD |
||||
Intel 520 Series SSD |
77.7 MB/s |
BL |
- 35.1% |
- 61.6% |
- 71.4% |
||
Intel X25-M G2 SSD |
50.4 MB/s |
+ 54.2% |
BL |
- 40.9% |
- 56.0% |
||
1 TB VelociRaptor |
29.8 MB/s |
+ 160.7% |
+ 69.1% |
BL |
- 25.5% |
||
600 GB VelociRaptor |
22.2 MB/s |
+ 250.0% |
+ 127.0% |
+ 34.2% |
BL |
||
High-End Disk WinBench 99
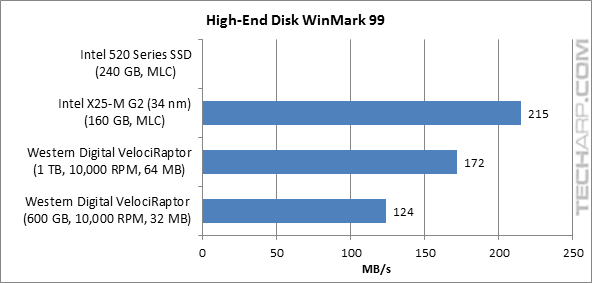
In this test, the Intel 520 Series SSD was so fast WinBench 99 could not register a result even though it successfully completed the test (it seemed to be limited to a maximum of 250 MB/s). It was certainly faster than the 160 GB Intel X25-M G2 (34 nm) solid state drive, which was itself 25% faster than the new 1 TB Western Digital VelociRaptor, and almost 75% faster than the 600 GB Western Digital VelociRaptor.
HDD / SSD Model |
Transfer |
Difference |
Useful Links |
||||
Intel 520 |
Intel X25-M |
1 TB WD |
600 GB WD |
||||
Intel 520 Series SSD |
NA |
BL |
NA |
NA |
NA |
||
Intel X25-M G2 SSD |
215 MB/s |
NA |
BL |
- 20.0% |
- 42.3% |
||
1 TB VelociRaptor |
172 MB/s |
NA |
+ 25.0% |
BL |
- 27.9% |
||
600 GB VelociRaptor |
124 MB/s |
NA |
+ 73.4% |
+ 38.7% |
BL |
||
Transfer Rate Range
This chart shows you the range of platter-to-buffer transfer rates from the innermost track to the outermost track for hard disk drives, and the range of memory cell-to-controller transfer rates for solid state drives. In other words, it shows you the range of transfer rates of hard disk drives and solid state drives (from minimum and maximum).
![]()
While these results show a wide gap in raw transfer rates between the HDDs and SSDs, we need to note that while this test shows the reducing performance of HDDs as they fill up with data and move to the inner tracks, it won't show you the detrimental effects of filling up a SSD.
Support Tech ARP!
If you like our work, you can help support out work by visiting our sponsors, participate in the Tech ARP Forums, or even donate to our fund. Any help you can render is greatly appreciated!
Page |
Topic |
|
1 |
• VelociRaptors Vs. Solid State Drives |
|
2 |
• Testing The HDDs & SSDs |
|
3 |
||
4 |
||
5 |
||
6 |
||
7 |
||
8 |
||
9 |
<<< Testing The Drives, Max. Surface Temperature, Data Transfer Profile : Previous Page | Next Page : IO Meter Random Access Performance >>>