


 Add to Reddit

CPU Core Computations
For the processor tests, Microsoft associate level breaks with the expected performance for different levels of processors. For example, in Windows Vista, Microsft set three 'lines' for CPUs :
- At about 850 MHz, a single-core AMD Athlon (K7) or Intel Pentium 4 corresponded to 2.0 and the score generally increased linearly with improved performance through 4.7.
- Mainstream dual-core performance begins at 4.8.
- In Windows Vista, the CPU scale was adjusted so the high-end dual-core parts received about a 5.8.
The current Windows 7 CPU assessments support up to 8 cores and can go to 16 cores without any changes. The current synthetic processor assessments are sufficient to assess the performance of 8-core systems with symmetric multi-threading. The Windows 7 CPU scoring rules are straightforward :
- Systems with performance equivalent to that expected for a CPU with one or two physical cores can get a maximum score of 5.9.
- 6.0 to 6.5 represents performance equivalent to that expected from high-end dual-core CUs that were ‘capping out’ at 5.9 in Windows Vista.
- 6.3 to 6.9 is equivalent to to well-performing triple-core parts. Microsoft set the 6.9 point to be just under the performance expected for well-performing quad-core processors.
- 7.0+ has been set to the performance level of mainstream quad-core processors.
- Microsoft set 7.9 at the inferred performance of eight-core processor with SMT.
Note that this overlapping in the ranges is intentional. Scoring is not tied to the number of cores present, but rather to the level of performance. For example, it is possible for some dual-core processors to outscore some triple-core processors.
Addition Of A Single-Threaded CPU Assessment
For the WinEI formal assessment in Windows Vista, the four WinEI CPU assessments ran in a multi-threaded manner – one “measurement thread” per CPU. In addition, these assessments have always supported running in single-threaded mode.
In Windows 7, Microsoft added a run of the these assessments in single-threaded mode to the set of formal assessments. This lets the model account for the way processors scale in both a multi-core and single core manner.
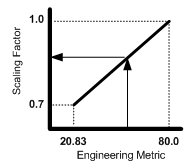 |
This has been implemented as a scaling factor applied to the overall CPU score. This scaling factor is computed by taking the geometric mean of the four single-threaded CPU assesment metrics (not scores) and computing a value between 1.0 and 0.7. The CPU score is then multiplied by the scaling factor. The resulting value becomes the top level CPU score for the system. This scaling factor is never greater than 1.0 and never less than 0.7.
In Windows 7, 1.0 corresponds to a value of 80.00 MB/s and 0.7 corresponds to a value of 20.83 MB/s. This scaling factor is computed using a simple linear conversion as follows.
Support Tech ARP!
If you like our work, you can help support out work by visiting our sponsors, participate in the Tech ARP Forums, or even donate to our fund. Any help you can render is greatly appreciated!
<<< Will My System Get The Same Score?, Memory Performance & Size : Previous Page | Next Page : How Does The CPU Score Correlate With User Experience? >>>