


 Add to Reddit

How Much Performance Increase Can You Expect?
Fuzzy 3D very kindly provided us with benchmark results using this system :
Processors |
Intel Core 2 Quad Q6600 |
Motherboard |
Gigabyte P35-DS3P (Intel P35) |
Memory |
Two G.Skill 2 GB PC2-6400 DDR2 modules |
Graphics Card |
EVGA GeForce 8800 Ultra |
Graphics Drivers |
GeForce ForceWare 6.14.11.7474 |
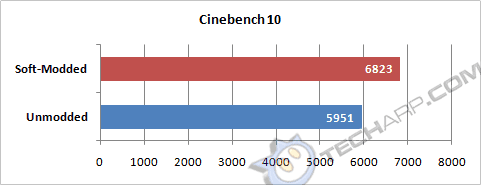
Cinebench 10 (Open GL)
|
Unmodded |
Soft-Modded |
Difference |
Cinebench 10 |
5951 |
6823 |
+ 14.7 % |
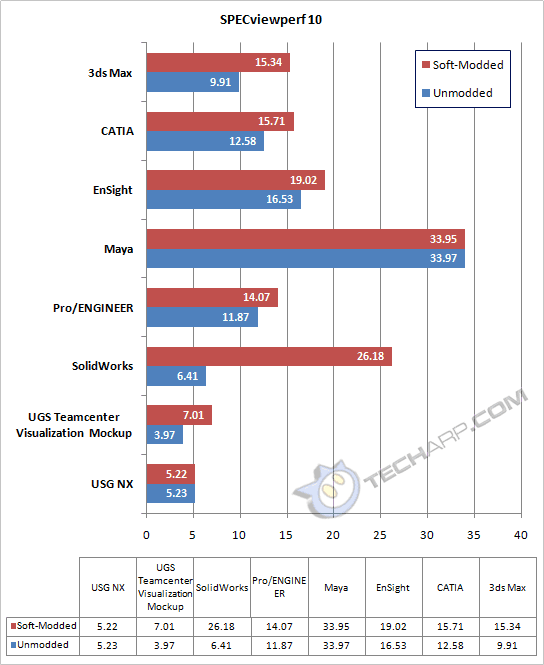
SPECviewperf 10
|
Unmodded |
Soft-Modded |
Difference |
3ds Max |
9.91 |
15.34 |
+ 54.8 % |
CATIA |
12.58 |
15.71 |
+ 24.9 % |
EnSight |
16.53 |
19.02 |
+ 15.1 % |
Maya |
33.97 |
33.95 |
- |
Pro/ENGINEER |
11.87 |
14.07 |
+ 18.5 % |
SolidWorks |
6.41 |
26.18 |
+ 308.4 % |
UGS Teamcenter |
3.97 |
7.01 |
+ 76.6 % |
USG NX |
5.23 |
5.22 |
- |
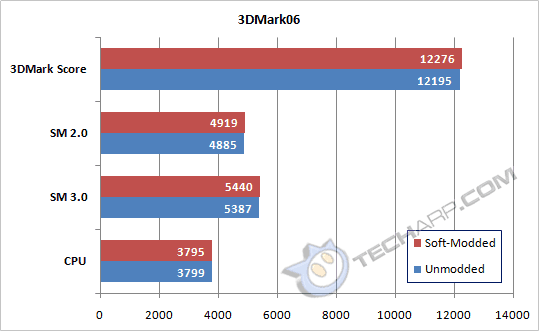
3DMark06
|
Unmodded |
Soft-Modded |
Difference |
3DMark Score |
12195 |
12276 |
+ 0.7 % |
SM 2.0 |
4885 |
4919 |
+ 0.7 % |
SM 3.0 |
5387 |
5440 |
+ 1.0 % |
CPU |
3799 |
3795 |
- |
Support Tech ARP!
If you like our work, you can help support out work by visiting our sponsors, participate in the Tech ARP Forums, or even donate to our fund. Any help you can render is greatly appreciated!
|
|
Page |
Topics |
|
1 |
|||
2 |
|||
3 |
|||
4 |
|||
5 |
|||
6 |
|||
7 |
|||
8 |
|||
9 |
|||
10 |
Latest Performance Results! |