


 Add to Reddit

Platter Data Transfer Profiles
These charts show you the range of platter-to-buffer transfer rates from the innermost track to the outermost track. In other words, it shows you the range of disk transfer rates of the hard drives (from minimum and maximum).
The Original Profiles
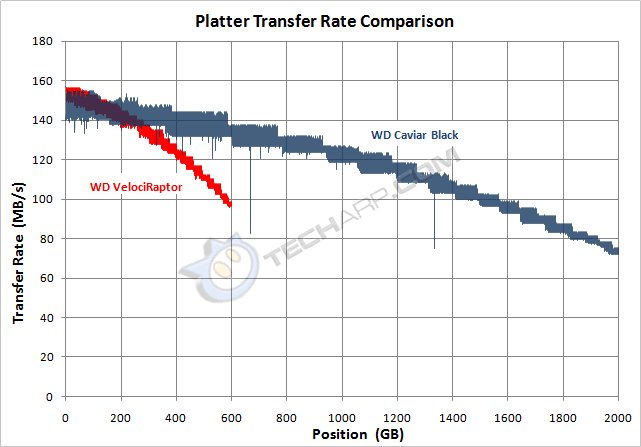
Both drives started at around the same level. The 600 GB Western Digital VelociRaptor started a little higher at 153 MB/s, while the 2 TB Western Digital Caviar Black started at 146 MB/s.
The Caviar Black achieved transfer rate parity with the VelociRaptor at about the 180 GB point, and thereafter, the Caviar Black was faster than the VelociRaptor up to about 155 GB.
After Short Stroking
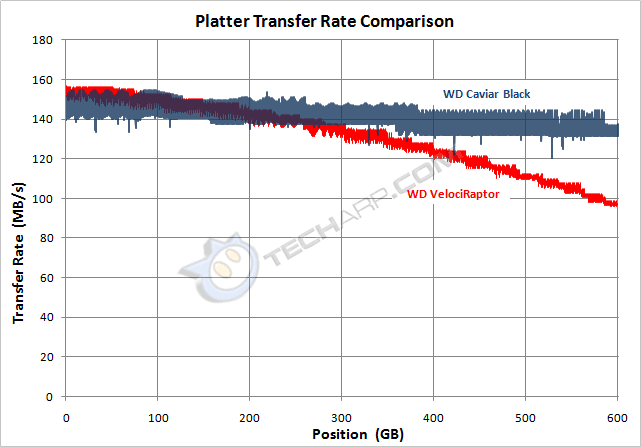
After short stroking the Caviar Black hard disk drive, it shows an obvious advantage in raw transfer rate over the VelociRaptor. Despite the VelociRaptor's higher spindle speed, the Caviar Black was faster after the first 180 GB.
The Caviar Black was almost as fast at the end of the 600 GB partition, as it was at the beginning, losing just 8 MB/s (5.5%) in throughput. The VelociRaptor, on the other hand, rapidly lost throughput - going below 100 MB/s at its innermost tracks. At these slowest tracks, the Caviar Black was 40 MB/s (40.8%) faster than the VelociRaptor.
What Does This Mean?
These platter profiles show us the advantage of short stroking. By restricting ourselves to the fastest part of the hard disk drive, we make the drive appear faster. However, this is an illusion because the transfer rate did not actually improve. If you compare both charts, you will see that the transfer rate profiles remain the same, even after short stroking the drive.
This test is a good way to show you how short stroking can skew your perception. At first glance, short stroking appears to make the 2 TB Western Digital Caviar Black much faster than the 600 GB Western Digital VelociRaptor, but the reality is quite different as you will see in the next tests.
Support Tech ARP!
Help support our work by visiting our sponsors, participate in the Tech ARP Forums, or even donate to our fund. Any help you can render is greatly appreciated!
Support us by buying from Amazon.com! |
|
| Grab a FREE 30-day trial of Amazon Prime for free shipping, instant access to 40,000 movies and TV episodes and the Kindle Owners' Lending Library! | |
<<< What Effect Does It Have On Performance?, The Testbed, Testing Methodology : Previous Page | Next Page : WinBench 99 Test Results, Disk Transfer Rate Results >>>