


 Add to Reddit

IO Meter
We compared the Western Digital SiliconEdge Blue to the Intel X25-M G2 (34 nm). If you wish to see how the WD SiliconEdge Blue compares to other solid state drives, please take a look at our Solid State Drive Performance Comparison Guide.
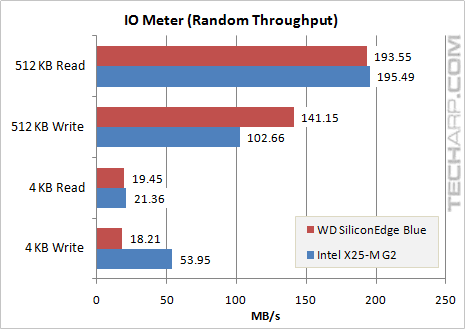
Throughput (Random Access)
Test |
WD SiliconEdge Blue |
Intel X25-M G2 |
Difference |
512 KB Read |
193.55 MB/s |
195.49 MB/s |
- 1.0% |
512 KB Write |
141.15 MB/s |
102.66 MB/s |
+ 37.5% |
4 KB Read |
19.45 MB/s |
21.36 MB/s |
- 8.9% |
4 KB Write |
18.21 MB/s |
53.95 MB/s |
- 66.3% |
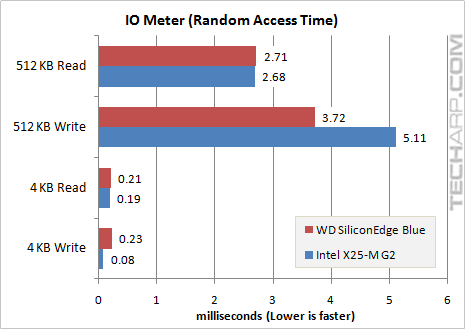
Random Access Time
Test |
WD SiliconEdge Blue |
Intel X25-M G2 |
Difference |
512 KB Read |
2.71 ms |
2.68 ms |
+ 1.1% |
512 KB Write |
3.72 ms |
5.11 ms |
- 27.3% |
4 KB Read |
0.21 ms |
0.19 ms |
+ 10.5% |
4 KB Write |
0.23 ms |
0.08 ms |
+ 181.3% |
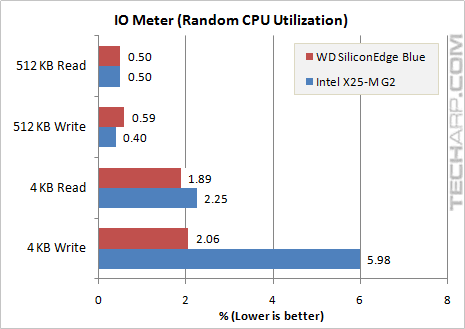
CPU Utilization (Random Access)
Test |
WD SiliconEdge Blue |
Intel X25-M G2 |
Difference |
512 KB Read |
0.50% |
0.50% |
- |
512 KB Write |
0.59% |
0.40% |
+ 49.4% |
4 KB Read |
1.89% |
2.25% |
- 16.0% |
4 KB Write |
2.06% |
5.98% |
- 65.6% |
Support Tech ARP!
If you like our work, you can help support out work by visiting our sponsors, participate in the Tech ARP Forums, or even donate to our fund. Any help you can render is greatly appreciated!
Page |
Topic |
|
1 |
• Overview |
|
2 |
||
3 |
• The WD SiliconEdge Blue 256 GB SSD |
|
4 |
||
5 |
||
6 |
||
7 |
||
8 |
||
9 |
||
10 |
||
11 |
||
12 |
||